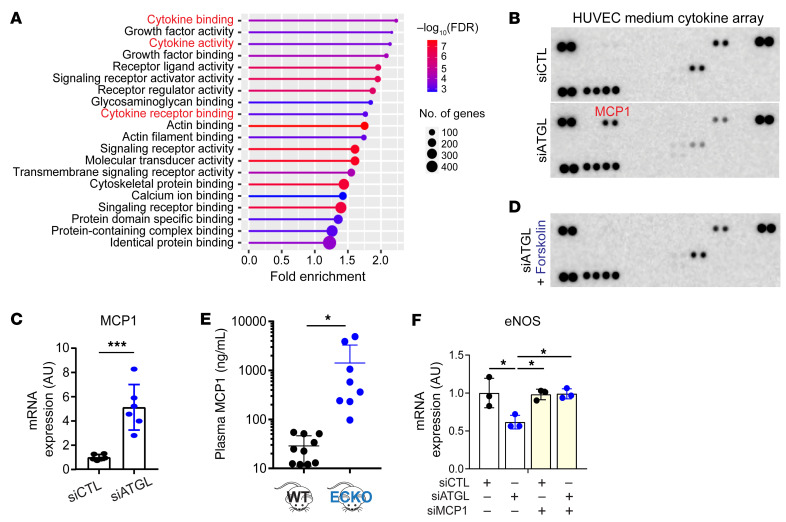
Figure 6. Endothelial LDs induce MCP1 production.
(A) Molecular function GO analysis of differentially expressed genes in HUVECs treated with siCTL versus siATGL. (B) Cytokine array assay with media conditioned by HUVECs treated with siCTL versus siATGL. (C) Quantification of MCP1 mRNA by qPCR in HUVECs treated with siATGL. n = 6. ***P < 0.001, t test. (D) As in B, simultaneously treated with forskolin. (E) Luminex analysis of MCP1 levels in plasma from WT versus Atgl ECKO mice. *P < 0.05, t test. n = 8–10 mice. (F) Quantification of eNOS mRNA by qPCR in HUVECs treated with the indicated siRNAs. n = 3. *P < 0.05, 1-way ANOVA.

