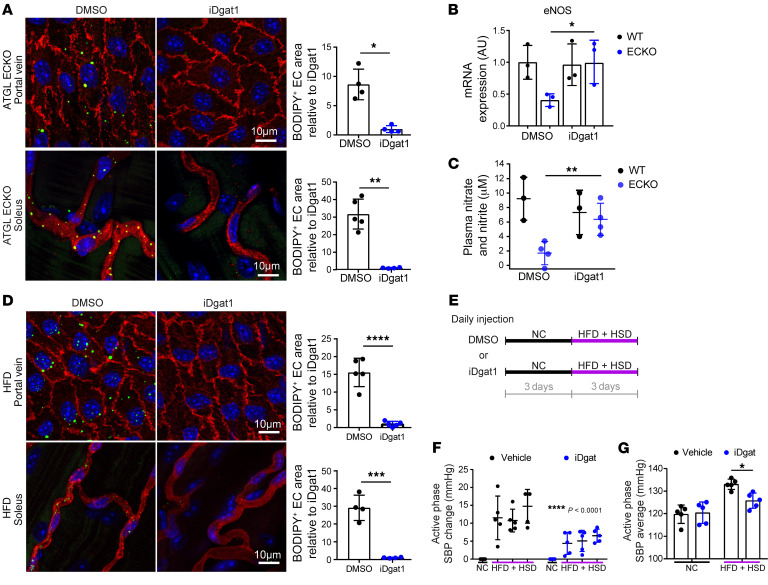
Figure 7. Suppression of LD formation rescues the induction of BP by endothelial ATGL deletion or by HFD.
(A) En face staining of portal vein (upper panel) and whole-mount staining of capillary vessels in the soleus (lower panel) after DMSO versus iDGAT1 injection in Atgl ECKO mice. iDGAT1 was given at 3 mg/kg via i.p. injection. BODIPY staining (green) indicates neutral lipids, and CD31 (red) marks the endothelium. BODIPY-positive area in the endothelium is quantified. *P < 0.05; **P < 0.01, t test. n = 4–5 mice/group. (B) eNOS mRNA levels measured in isolated ECs from lung of WT versus Atgl ECKO mice after a week of DMSO versus iDGAT1 injection. n = 3. *P < 0.05, 1-way ANOVA. (C) Nitrate and nitrite levels measured in the plasma of WT versus Atgl ECKO mice after a week of DMSO or iDGAT1 injection (3 mg/kg i.p.). **P < 0.01, 1-way ANOVA. n = 3–4 mice/group. (D) En face staining of portal vein (upper panel) and whole-mount staining of capillary vessels in the soleus (lower panel) after DMSO versus iDGAT1 injection (3 mg/kg i.p.) in C57BL/6J WT mice maintained on a 3-day HFD. BODIPY staining (green) indicates neutral lipids, and CD31 (red) marks the endothelium. BODIPY-positive area in the endothelium is quantified on the right. n = 4–5. ***P < 0.001; ****P < 0.0001, t test. (E) Experimental setup of daily administration of DMSO or iDGAT1 in C57BL/6J WT mice while providing NC or HFD+HSD. (F) Elevation of SBP during the active phase while provided with the indicated diet. ****P < 0.0001, 2-way ANOVA. n = 5 mice/group. (G) Average active phase SBP while provided with the indicated diet. *P < 0.05, 1-way ANOVA. n = 5 mice/group.

