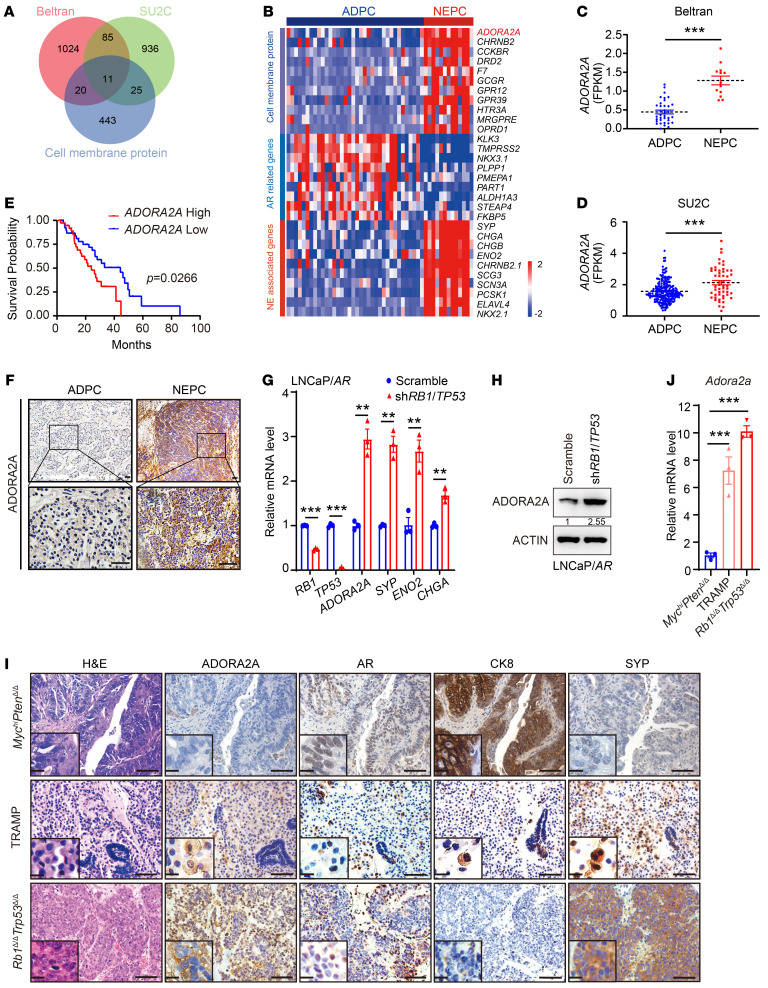
Figure 1. ADORA2A is a selectively upregulated cell membrane protein in NEPC.
(A) Screening the upregulated cell membrane proteins in NEPC versus ADPC based on reanalysis of Beltran (24) (NEPC, n = 13; ADPC, n = 36) and SU2C (25) (NEPC, n = 52; ADPC, n = 214) PCa data sets. (B) The heatmap reveals that ADORA2A is a top-ranked cell membrane protein in NEPC versus ADPC based on Beltran PCa data set (24). (C and D) Quantification of ADORA2A mRNA levels in ADPC and NEPC using Beltran (24) (C) and SU2C (D) PCa data sets (25). (E) The Kaplan-Meier survival curves exhibit a significantly shorter survival of patients with a high ADORA2A expression based on SU2C (High, n = 38; Low, n = 41) PCa data sets (25), cutoff value was 50%. (F) Representative IHC showing the ADORA2A levels in ADPC (n = 35) and NEPC (n = 31) clinical tumor sections. Upper panel scale bar: 200 μm; Lower panel scale bar: 50 μm. (G) Representative RT-qPCR shows mRNA levels in LNCaP/AR-shRB1/TP53 and scramble cells (n = 3 independent experiments). (H) Representative immunoblotting demonstrates an elevated ADORA2A level in LNCaP/AR-shRB1/TP53 compared with scramble cells (n = 3 independent experiments). (I) H&E showing the histology of MychiPtenΔ/Δ, TRAMP, and Rb1Δ/ΔTrp53Δ/Δ prostate tumors from 6-to-8-month-old mice (the left panel). IHC staining demonstrates the expression of ADORA2A, AR, CK8, and SYP in these tumors (scale bar: 100 μm; zoom in area scale bar: 5 μm). (J) RT-qPCR showing Adora2a levels from organoids from indicated GEMMs (n = 3 biological replicates). For statistical analysis, student’s t tests were used for C and G; Mann-Whitney test was utilized for D; Log-rank test was employed in E; 1-way ANOVA with Dunnett’s posthoc test was applied in J. *P < 0.05, **P < 0.01, ***P < 0.001, data are presented as mean ± SEM.

