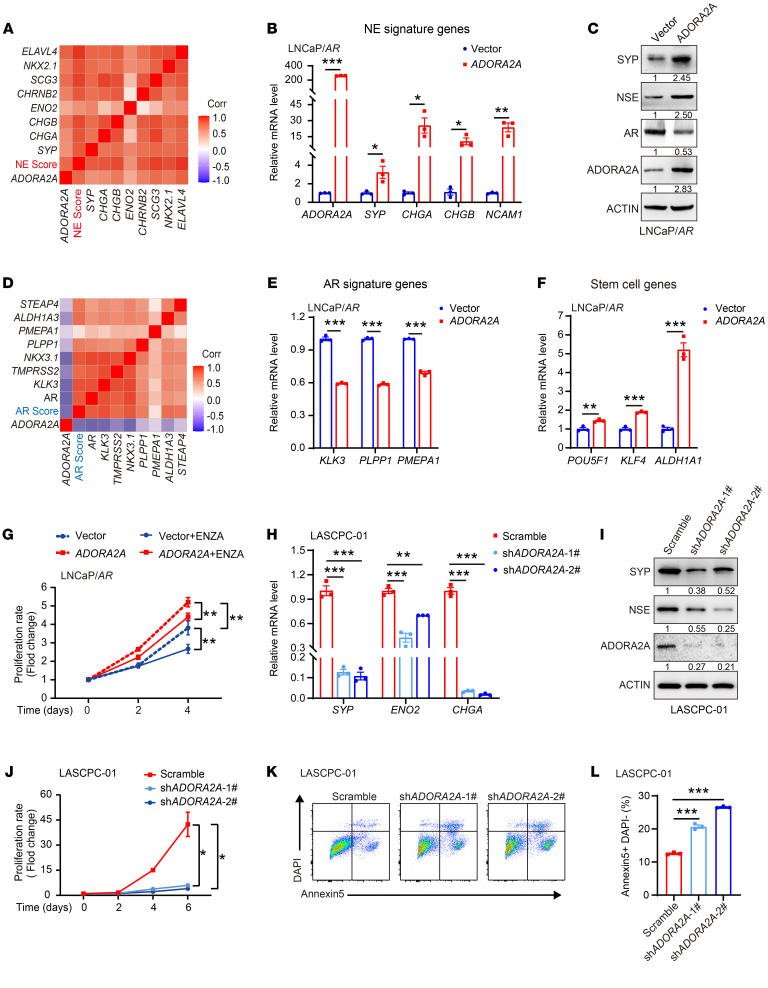
Figure 2. ADORA2A promotes lineage plasticity and resistance to ADT in PCa cells.
(A) Correlation analysis demonstrates a strong positive association between ADORA2A mRNA levels and NE-lineage gene signatures based on the Beltran PCa data set (24). (B) RT-qPCR results confirm ADORA2A-OE in LNCaP/AR-ADORA2A cells and suggest that NE-lineage associated genes are elevated in ADORA2A-OE LNCaP/AR cells compared with vector cells (n = 3). (C) Immunoblots of NE-lineage molecules and AR in ADORA2A-OE LNCaP/AR cells and vector control cells. (D) ADORA2A mRNA levels are negatively correlated with expression of AR signaling signature genes based on the analysis of the Beltran PCa data set (24). (E and F) RT-qPCR analysis of AR signature genes and stem cell marker genes in LNCaP/AR-vector and LNCaP/AR-ADORA2A cells (n = 3). (G) In vitro cell growth curves of LNCaP/AR-ADORA2A and LNCaP/AR-vector cells cultured in control medium or enzalutamide (ENZA, 15 μM)-containing medium (n = 5 biological replicates). (H and I) RT-qPCR (H) and immunoblotting (I) results demonstrate NE-lineage genes are decreased in response to the downregulation of ADORA2A in LASCPC-01 cells (n = 3). (J) Cell growth curves of LASCPC-01-scramble cells and LASCPC-01-shADORA2A cells within 6 days (n = 4 biological replicates). (K and L) Flow cytometry analysis (K) and quantification (L) of the apoptotic cells in LASCPC-01-scramble and LASCPC-01-shADORA2A cells (n = 3 biological replicates). For statistical analysis, student’s t test was used for B, E, and F; 1-way ANOVA with Dunnett’s posthoc test was utilized for H and L; 2-way ANOVA with Turkey’s posthoc test was applied in G and J. *P < 0.05, **P < 0.01, ***P < 0.001, data are presented as mean ± SEM. RT-qPCR and immunoblotting were repeated in at least 3 independent experiments, with similar results, and representative images are shown.

