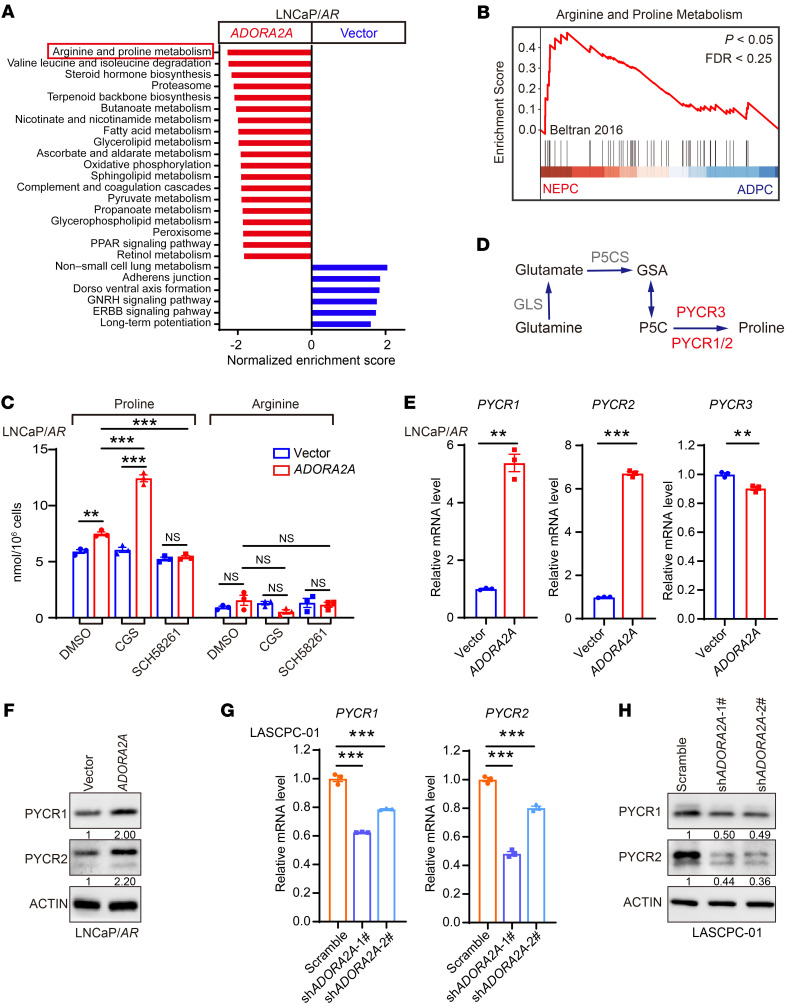
Figure 3. ADORA2A signaling promotes the proline synthesis by upregulating PYCRs.
(A) GSEA analysis reveals upregulated biological processes and pathways in KEGG enrichment analysis in LNCaP/AR-ADORA2A versus LNCaP/AR-vector cells (n = 3 biological replicates per cell line). (B) The GSEA plot shows that arginine and proline metabolism-related genes are enriched in NEPC compared with ADPC based on analysis of the Beltran PCa data set (24). (C) Mass spectrometry assesses the intracellular amount of proline and arginine in LNCaP/AR-vector and LNCaP/AR-ADORA2A cells in the absence or in the presence of ADORA2A agonist CGS (100 nM, treated for 48 hours) or antagonist SCH58261 (25 μM, treated for 48 hours) (n = 3 biological replicates/group). (D) The schematic flowchart displays the proline synthesis and key enzymes. (E and F) RT-qPCR (E) and immunoblotting (F) assays reveal the expression levels of PYCR1, PYCR2, and PYCR3 in response to ectopic expression of ADORA2A in LNCaP/AR cells (n = 3). (G) RT-qPCR data demonstrate decreases of PYCR1 and PYCR2 transcription upon the downregulation of ADORA2A via shRNA in LASCPC-01 cells (n = 3). (H) Immunoblotting results display reduced PYCR1 and PYCR2 at the protein level in response to ADORA2A knockdown in LASCPC-01 cells. For statistical analysis, 1-way ANOVA with Turkey’s posthoc test and Kruskal-Wallis test with Dunnett’s posthoc test was utilized for C; student’s t test was used for E; 1-way ANOVA with Dunnett’s posthoc test was applied in G.**P < 0.01, ***P < 0.001, data are presented as mean ± SEM. RT-qPCR and immunoblotting were repeated in 3 independent experiments, with similar results, and representative images are shown.

