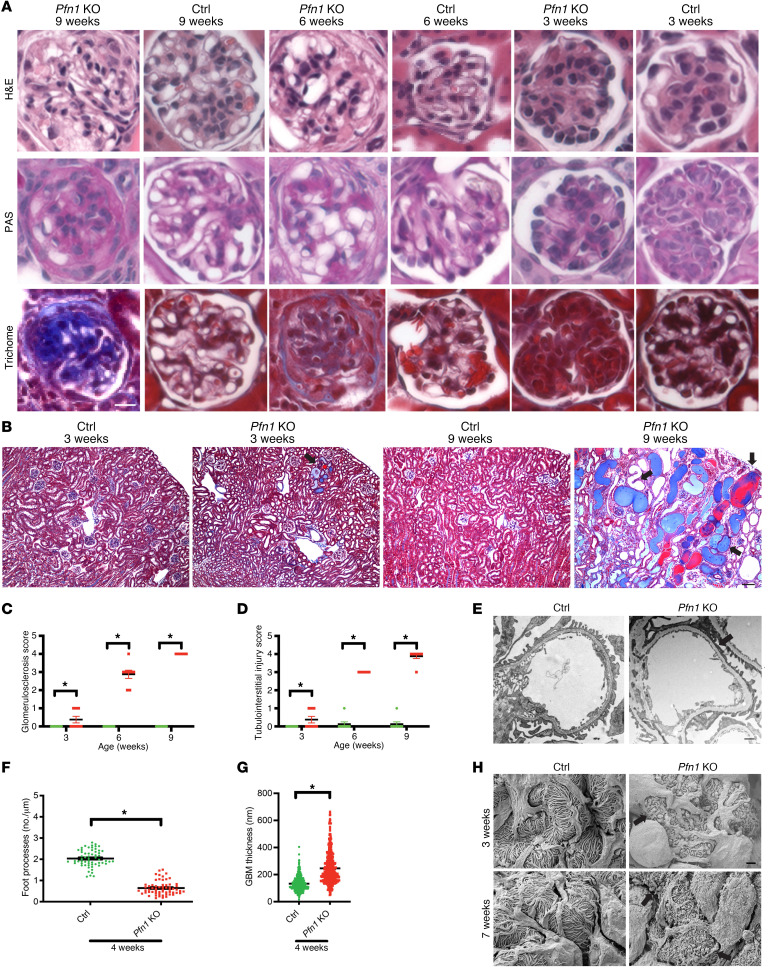
Figure 2. Loss of podocyte Pfn1 results in progressive glomerulosclerosis and tubulointerstitial injury.
(A) Representative light microscopy images (H&E, periodic acid–Schiff [PAS], and Masson’s trichrome) of control and Pfn1-KO mouse glomeruli at 3, 6, and 9 weeks of age. Scale bar: 25 μm. (B) Representative Masson’s trichrome staining in control and Pfn1-KO mouse kidneys at 3 and 9 weeks of age. Arrowheads depict dilated tubules, proteinaceous casts, and interstitial fibrosis. Scale bar: 100 μm. (C) Quantification of glomerulosclerosis in A. n = 8 mice. *P < 0.05 vs. control. (D) Quantification of tubulointerstitial injuries in B. n = 8 mice. *P < 0.05 vs. control. (E) Representative transmission electron micrography (TEM) of foot processes in control and Pfn1-KO mice at 4 weeks of age. Arrowheads depict podocyte foot process effacement. Scale bar: 1 μm. (F) Quantification of the number of foot processes per micrometer of GBM in E. n = 4 mice, *P < 0.05 vs. control. (G) Quantification of GBM thickness in E. n = 4 mice. *P < 0.05 vs. control. (H) Representative scanning electron micrography illustrating the ultrastructure of the glomerulus of control and Pfn1-KO mice at 3 and 7 weeks of age. Arrowheads demonstrate loss of foot process interdigitations. Scale bar: 1 μm. Statistics were analyzed via a 2-tailed t test.

