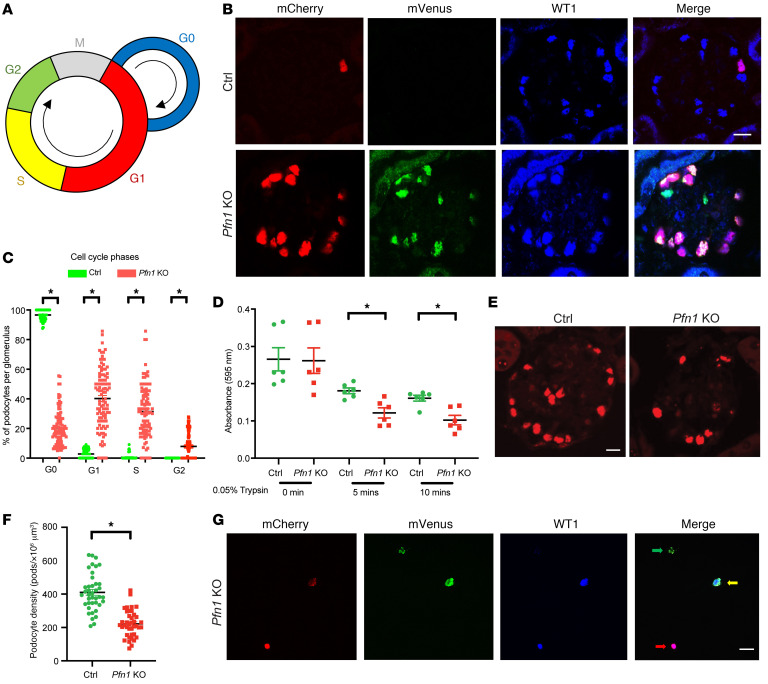
Figure 5. Loss of podocyte Pfn1 results in podocytopenia and cell cycle entry.
(A) A schematic representing cell cycle phase visualization by different colors in podocytes from the R26Fucci2aR Pfn1-KO mice. G1 phase nuclei (mCherry, red); S phase nuclei (both mCherry and mVenus, yellow); and G2 phase nuclei (mVenus, green). (B) Representative immunofluorescence images of podocytes in control-FUCCI and Pfn1-KO-FUCCI glomeruli at 4 weeks of age stained with Cherry (red), Venus (green), and WT1 (blue). Scale bar: 20 μm. (C) Quantification of the distribution of podocytes in cell cycle phase in B. Total of 100 glomeruli in 5 different mice. (D) Primary podocytes isolated from control and Pfn1-KO mice demonstrated a significant decrease in adhesion after plating for 5 minutes and 10 minutes on the collagen type I–coated plates. n = 6 independent experiments. (E) Representative immunofluorescence images of podocytes in control and Pfn1-KO glomeruli at 7 weeks of age stained with WT1 (red). Scale bar: 20 μm. (F) Quantification of podocyte density in glomeruli in E. Total of 40 glomeruli from 5 different mice. (G) Representative immunofluorescence images of urinary podocytes from control and Pfn1-KO mice at 4 weeks of age stained with mCherry (red), mVenus (green), and WT1 (blue). G1 phase podocyte nuclei (red arrow), S phase podocyte nuclei (yellow arrow), and G2 phase podocyte nuclei (green arrow) were depicted. Scale bar: 20 μm. *P < 0.05 vs. control. Statistics were analyzed via a 2-tailed t test.

