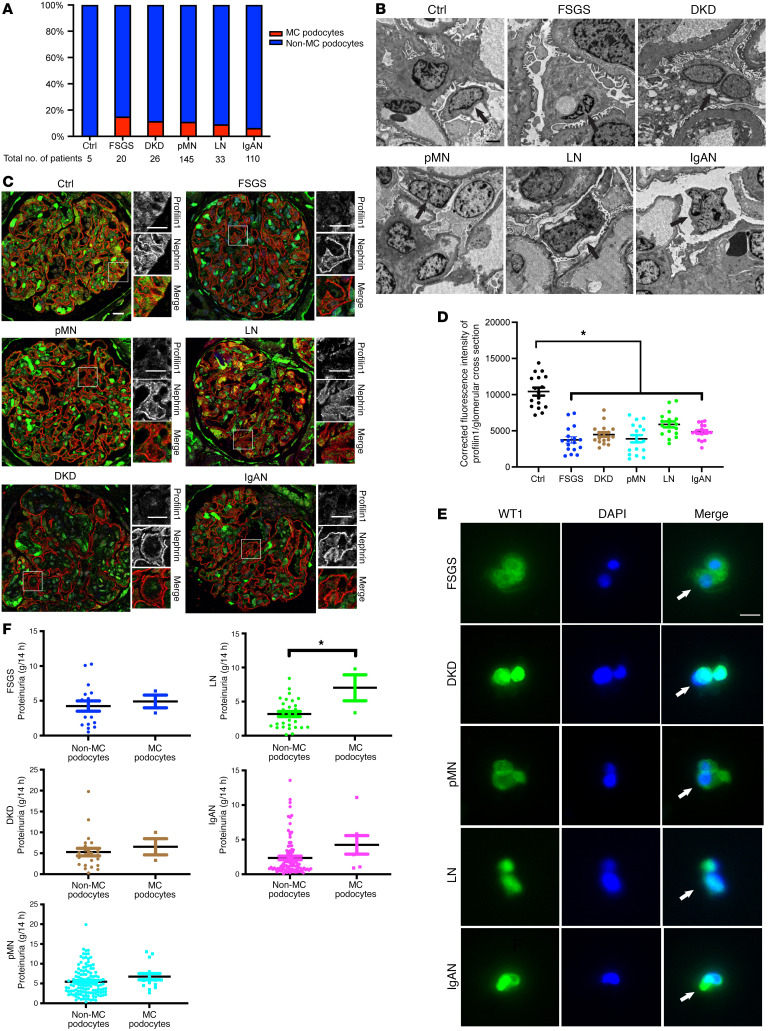
Figure 8. Patients with proteinuric kidney disease demonstrate reduced podocyte PFN1 expression and MC.
(A) The percentage of patients with MC podocytes observed in kidney biopsy specimens using transmission electron microscopy (TEM) in patients with nonglomerular disease following nephrectomy (control; 0 of 5 patients, 0%), patients with focal segmental glomerulosclerosis (FSGS; 3 of 20 patients, 15%), patients with diabetic kidney disease (DKD; 3 of 26 patients, 11.5%), patients with primary membranous nephropathy (pMN; 16 of 145 patients, 11%), patients with lupus nephritis (LN; 3 of 33 patients, 9.1%), and patients with IgA nephropathy (IgAN; 7 of 110 patients, 6.4%) hospitalized between September 2019 and August 2022. (B) Representative TEM images of kidney biopsy specimens. Mononucleated podocytes in control and MC podocytes in patients with FSGS, DKD, pMN, LN, and IgAN are depicted with arrows. Scale bar: 2 μm. (C) Representative immunofluorescence images of glomeruli in control patients and patients with FSGS, DKD, pMN, LN, and IgAN with MC podocytes observed with TEM stained with profilin1 (green) and nephrin (red). Scale bar: 20 μm. (D) Quantification of C examining mean immunofluorescence intensity of profilin1 in the glomeruli. Total of 17 glomeruli in 3 patients from each group. *P < 0.05. Statistics were analyzed via a 1-way ANOVA with Dunnett’s correction. (E) Representative immunofluorescence images of urine samples in patients with FSGS, DKD, pMN, LN, and IgAN with MC podocytes stained with WT1 (green) and DAPI (blue). Arrows denote multinuclei. Scale bar: 20 μm. (F) Quantification of urine protein excretion in patients with FSGS, DKD, pMN, LN, and IgAN at the time of kidney biopsy. MC podocytes and non-MC podocytes were observed with TEM individually in each group.*P < 0.05. Statistics were analyzed via a 2-tailed t test.

