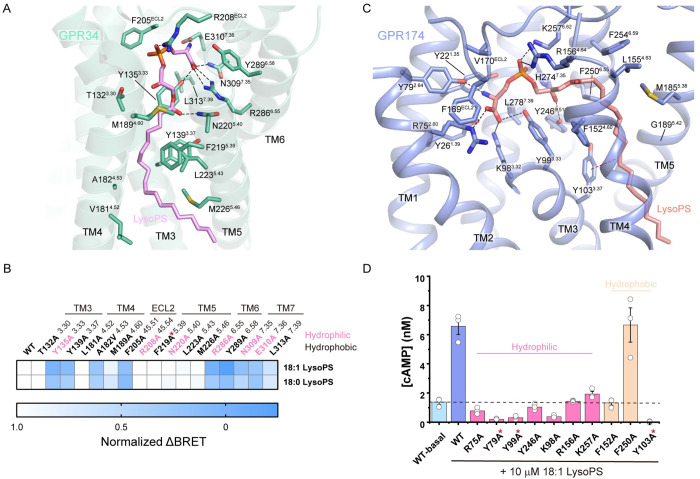
Fig 2. Recognition of LysoPS by GPR34 and GPR174.
(A) Interactions between LysoPS and GPR34. Polar interactions are depicted as black dashed lines. (B) Normalized ΔBRET of GPR34 mutants in response to 10 μM LysoPS relative to wild-type GPR34 in Gi-dissociation assays. (C) Interactions between LysoPS and GPR174. Polar interactions are depicted as black dashed lines. The π–π interaction is depicted as a red dashed line. (D) Net cAMP accumulation of CHO cells expressing GPR174 mutants in response to 10 μM LysoPS. WT-basal represents net cAMP accumulation of cells expressing wild-type GPR174 in the absence of exogenous LysoPS. Data represent mean ± SEM from 3 independent experiments. Mutants with expression less than half that of the wild-type receptor are labeled with red stars. The data used to generate graphs in Fig 2B and 2D are available in S1 Data.

