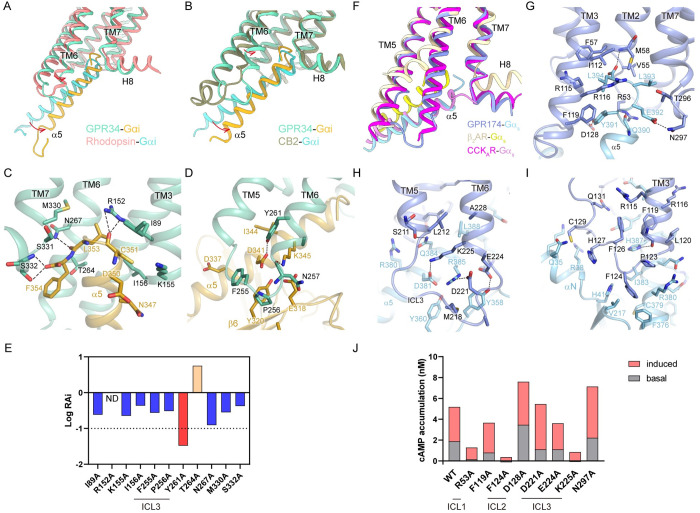
Fig 5. G protein coupling of GPR34 and GPR174.
(A) Structural superposition of GPR34-Gαi and rhodopsin-Gαi (PDB: 6cmo). Rhodopsin is colored pink, and Gi coupled to it is colored cyan. (B) Structural superposition of GPR34-Gαi and CB2-Gαi (PDB: 6pt0). CB2 is colored brown, and Gαi coupled to it is colored cyan. The displacements are indicated by arrows. (C) Interactions between the C terminus of α5 and GPR34. (D) Interactions between α5/β6 of Gαi and ICL3 of GPR34. (E) Relative intrinsic activity (RAi) plot of GPR34 mutants of the G protein–coupling sites in Gi-dissociation assays. RAi was calculated as [Emax(test)/EC50(test)]/[Emax(WT)/EC50(WT)]. Emax and EC50 are from the averaged concentration-response curves of 3 independent experiments. (F) Superposition of GPR174-Gαs, β2AR-Gαs (PDB: 3sn6), and CCKAR-Gαs (PDB: 7ezk). GPR174, β2AR, and CCRKAR are colored blue, light yellow, and magenta, respectively. Gαs subunits in these structures are colored light blue, yellow, and plum, respectively. (G) Interactions between the C terminus of α5 helix and GPR174. (H) Interactions between Gαs and ICL3 of GPR174. (I) Interactions between Gαs and ICL2 of GPR174. Polar interactions are depicted as black dashed lines. (J) Basal activity and maximal LysoPS-induced activity of GPR174 mutants in cAMP accumulation assays. Data are from the averaged concentration-response curves of 3 independent experiments. The data used to generate graphs in Fig 5E and 5J are available in S1 Data.

