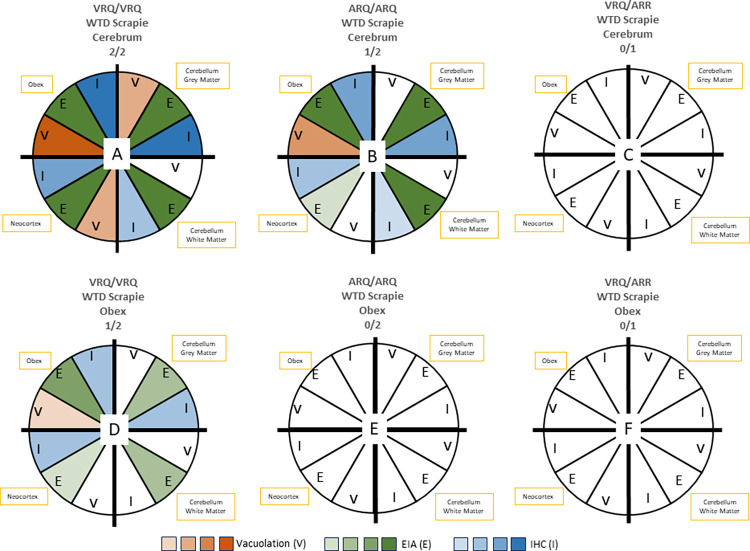
Fig 5. Association of vacuolation, EIA, and immunohistochemistry data with results by sheep genotype and inoculum source.
This summary demonstrates differences between sheep of different genotypes challenged with the same inoculum (A-C received inoculum from deer cerebrum; D-F received inoculum from deer obex) and sheep of the same genotype challenged with different inocula. Each quadrant represents a brain region tested (brainstem at the level of the obex, cerebellar grey matter, cerebellar white matter, or neocortex). Each wedge in the quadrant is a different test (vacuolation, EIA, or IHC). The color of the wedge represents the severity of the results from each test, where lower scores received a lighter shade and higher scores received a darker shade. Negative assays are denoted in white. A) VRQ/VRQ with deer cerebrum represents sheep 1 and 2; B) ARQ/ARQ sheep with deer cerebrum represents sheep 3; C) VRQ/ARR with deer cerebrum sheep 5. D) VRQ/VRQ sheep with deer obex represents sheep 6; E) ARQ/ARQ with deer obex represents sheep 8 and 9; F) VRQ/ARR with deer obex represents sheep 10.

