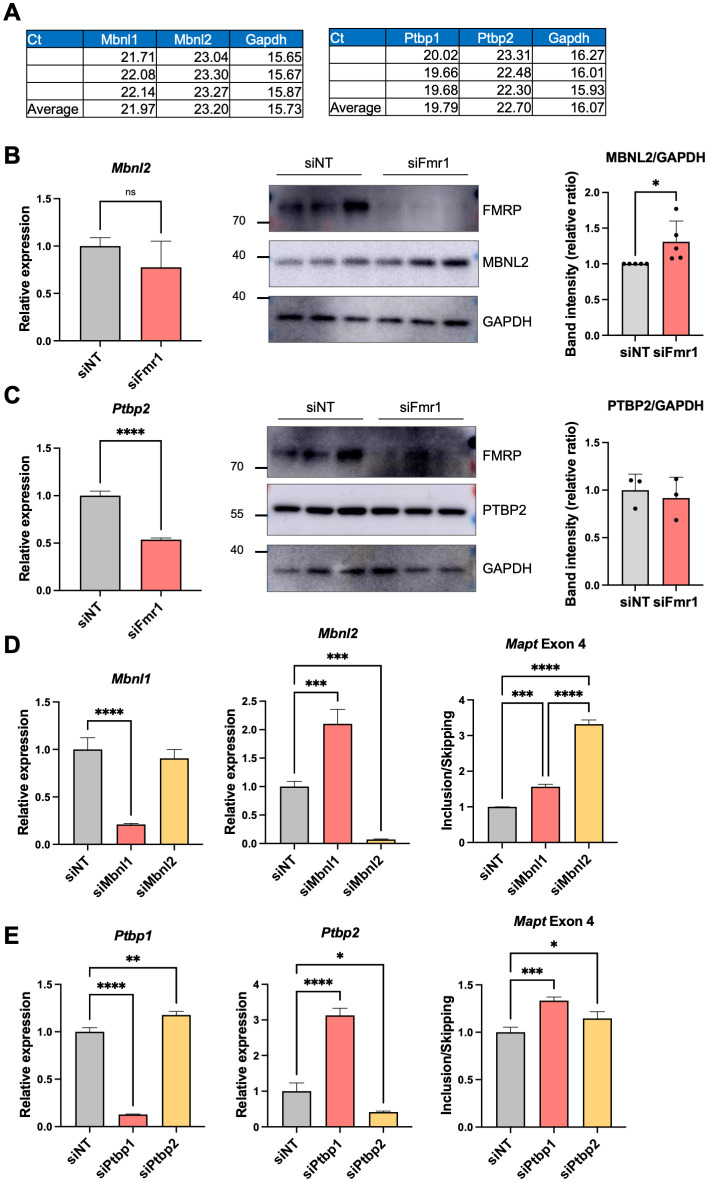
Fig 7. MBNL2 and PTPB2 are modestly down-regulated in Fmr1-deficient cells.
(A) Mbnl1, Mbnl2, Ptbp1, and Ptbp2 RNA levels (in Ct value) in N2A cells. (B) RT-qPCR analyses and representative western blots showing Mbnl2 and protein levels following Fmr1 depletion. Quantification of the MBNL2/GAPDH band intensity from 5 independent experiments is at the right. Mean ± SD is shown (Student’s t test, *p < 0.05). (C) RT-qPCR analyses and western blots showing Ptbp2 RNA and protein levels following Fmr1 depletion. Quantification of the PTBP2/GAPDH band intensity is at the right. Mean ± SD is shown (Student’s t test, ****p < 0.0001). (D) Mbnl1 and Mbnl2 expression as well as Mapt exon 4 inclusion/skipping following Mbnl1 or Mbnl2 depletion. P-values were calculated using one-way ANOVA and mean ± SD is shown (***p < 0.001; ****p < 0.0001). (E) Ptbp1 and Ptbp2 expression as well as Mapt exon 4 inclusion/skipping following Ptbp1 or Ptbp2 depletion. P-values were calculated using one-way ANOVA and mean ± SD is shown (*p < 0.05, **p <0.01, ***p < 0.001; ****p < 0.0001). The underlying data can be found in S3 Data.

