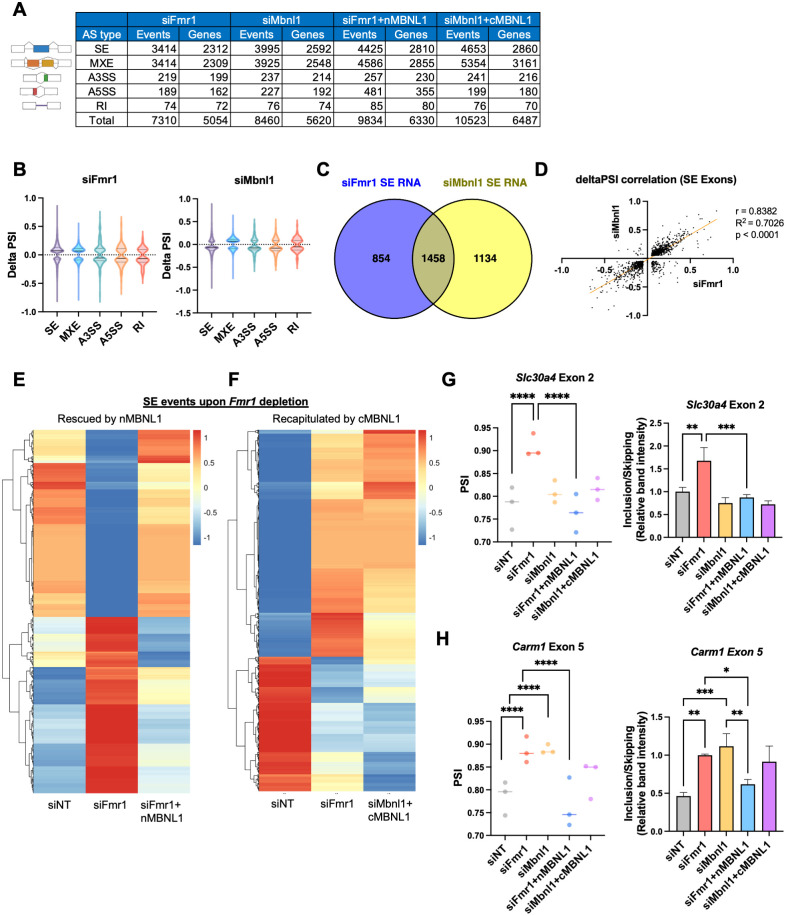
Fig 9. FMRP regulates alternative splicing through redistribution of MBNL1 isoforms.
(A) Changes in alternative RNA splicing across categories. (B) Violin plots illustrating the distribution of delta PSI in Fmr1 and Mbnl1-depleted cells. The solid line is the median and the dashed lines are quartiles. P-value < 0.05, |delta PSI| > 0.05. (C) Venn diagram comparing RNAs exhibiting skipped exon events in Fmr1 and Mbnl1-depleted cells. (D) Correlation plot showing the relationship of delta PSI values between Fmr1 and Mbnl1-depleted cells. (E) Heatmap visualizing the PSI values of mis-spliced RNAs in Fmr1-depleted cells, rescued by the overexpression of nMBNL1. PSI values were adjusted by z-score. (F) Heatmap displaying the PSI values of mis-spliced RNAs in Fmr1-depleted cells and cytoplasmic MBNL1 expressing cells (siMbnl1+cMBNL1), which is similar to the splicing changes upon Fmr1-depletion. PSI values were adjusted by z-score. (G) PSI values of Slc30a4 exon 2, rescued by nMBNL1. P-values were calculated using rMATS (****p < 0.0001). At right, RT-PCR validation of Slc30a4 exon 2 splicing. Band intensity was quantified and mean ± SD is shown (ANOVA, **p < 0.01, ***p < 0.001). (H) PSI values presented for Carm1 exon 5. P-values were calculated using rMATS (****p < 0.0001). At right, RT-PCR validation of Carm1 exon 5 splicing. Band intensities were quantified and mean ± SD is shown (ANOVA, *p < 0.05, **p < 0.01, ***p < 0.001). The underlying data can be found in S3 Data.

