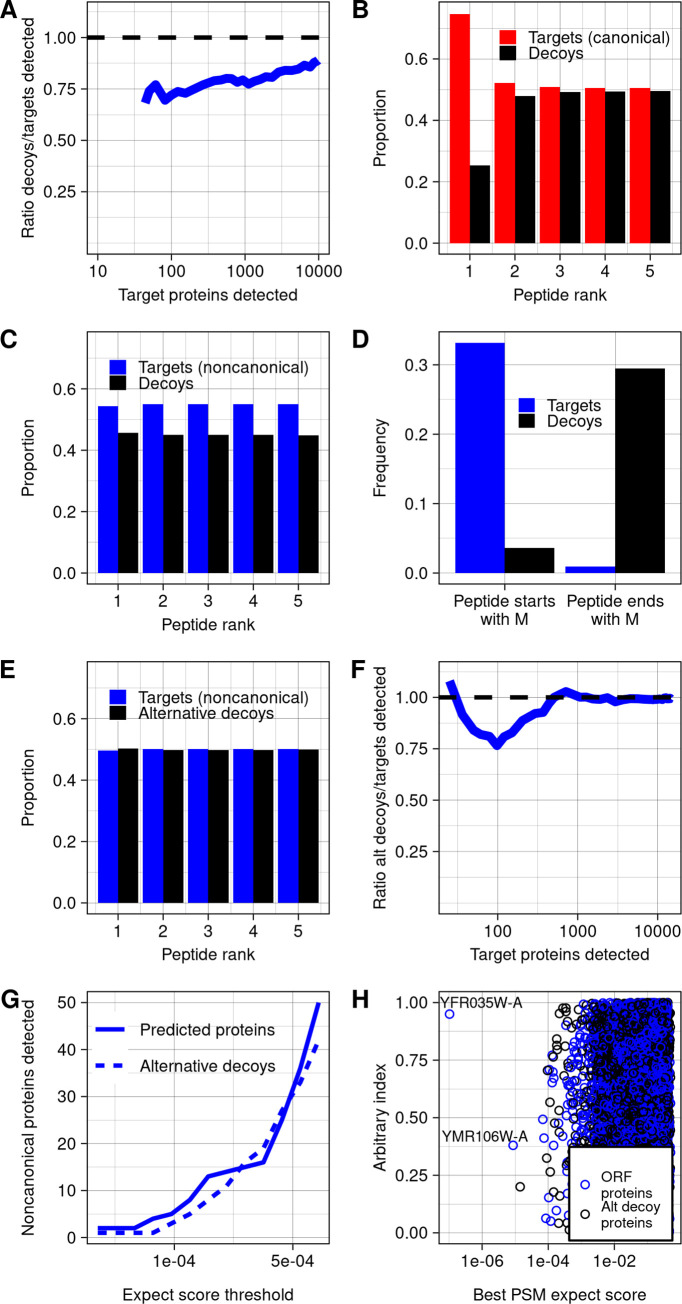
Fig 2. Decoy biases distort FDR estimation.
(A) Among noncanonical proteins, the ratio of decoys detected to targets detected, across a range of targets detected, which varies with expect score threshold. Decoys are reverse sequences of the noncanonical protein database. (B) Across all spectra, the proportion of PSMs of each rank that are canonical peptides vs. decoys. Peptide rank indicates the rank of the strength of the PSM, ordered across all peptides and decoys. (C) Across all spectra, the proportion of PSMs of each rank that are noncanonical peptides vs. decoys. (D) Among noncanonical ORF and decoy predicted trypsinized peptides that match spectra at any confidence level, the proportion that start or end with a methionine. (E) Across all spectra, the proportion of PSMs of each rank that are noncanonical peptides vs. decoys, using the alternative decoy set. Alternative decoys are constructed by reversing noncanonical proteins after the starting methionine such that all decoy and noncanonical proteins start with M. (F) Among noncanonical proteins, the ratio of decoys detected to targets detected across counts of targets detected, using the alternative decoy set. (G) The number of predicted proteins and decoys at a range of confidence thresholds, using the alternative decoy set. (H) The best PSM expect scores for each noncanonical protein and decoy in the database, using the alternative decoy set. The data underlying this Figure can be found in S1 Data. FDR, false discovery rate; ORF, open reading frame; PSM, peptide-spectrum match.

