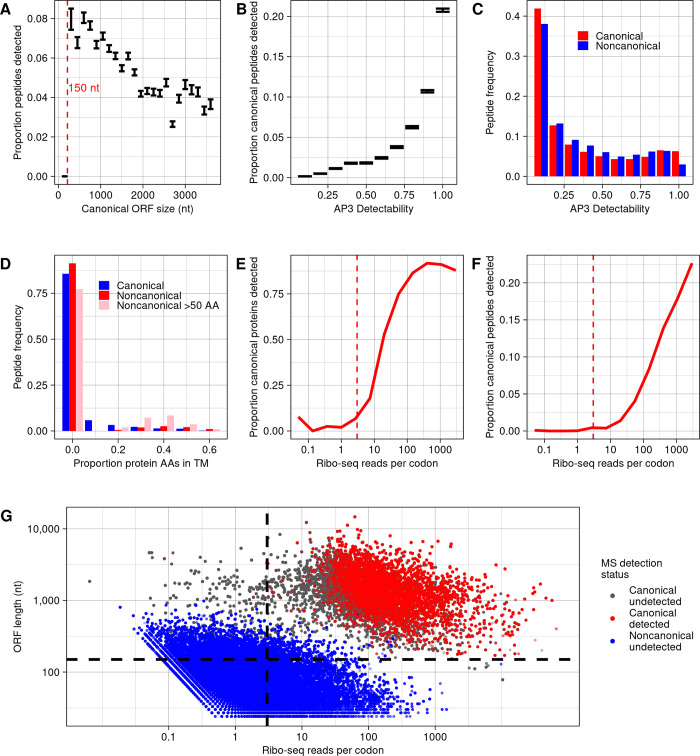
Fig 7. Lack of detection of noncanonical proteins can be largely explained by their low translation rate.
(A) The proportion of canonical peptides detected, among all eligible for detection, for ORFs of different size classes. Bars indicate a range of one standard error. A dashed line is drawn at 150 nt, below which no canonical peptides are detected. (B) The proportion of peptides detected, among all eligible for detection, for canonical proteins binned by detectability score given by the AP3 algorithm [53]. Bars indicate a range of one standard error. (C) Frequencies of predicted peptides by detectability score among canonical and noncanonical proteins. (D) Frequencies of predicted peptides among canonical proteins, noncanonical proteins, and noncanonical proteins larger than 50 amino acids, with proteins binned by proportion of amino acids in predicted transmembrane domains. Predictions were made using TMHMM [54]. The first bin includes only proteins with no transmembrane domain predicted. (E) Proportion of canonical proteins detected within bins defined by in-frame ribo-seq reads per codon mapping to the ORF. A dashed line is drawn at 3 reads per codon, below which few canonical proteins are detected. (F) Proportion of canonical peptides detected, out of all eligible, within bins defined by in-frame ribo-seq reads per codon. A dashed line is drawn at 3 reads per codon, below which few canonical peptides are detected. (G) For all peptides predicted from canonical and noncanonical translated ORFs with detectable mass and length, the in-frame ribo-seq reads per codon and ORF length is plotted. Each peptide is classed by whether it is canonical or noncanonical, and whether it is detected at a 10−6 expect score threshold. Nearly all detectable peptides are restricted to the top right section bound by dashed lines, where ORF length >150 nt and reads per codon >3. The data underlying this Figure can be found in S1 Data.

