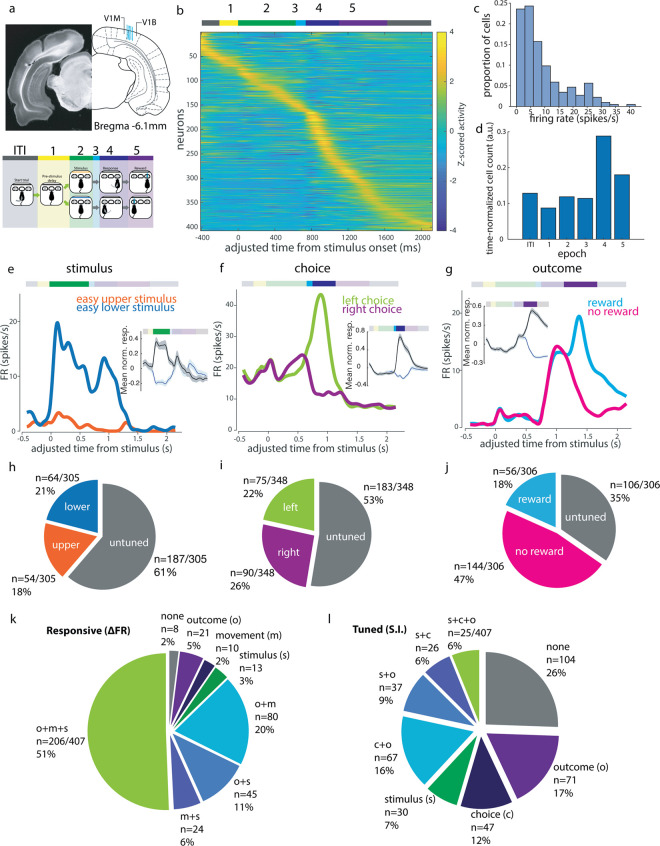
Fig 2. Tuned representations of several task features during visual decisions by V1 single neurons.
(a) Recording sites (blue lines each represent tetrode bundle center in one animal) and definitions of task epochs used in analysis. Schematic adapted from Paxinos and Watson [28]. V1M: primary visual cortex (monocular); V1B: primary visual cortex (binocular); V2L: secondary visual cortex, lateral area; V2MM: secondary visual cortex, mediomedial area; V2ML: secondary visual cortex, mediolateral area; ITI: intertrial interval. (b) Mean trial-aligned z-scored activity for all single units in the cloud of dots task (N = 5, n = 407) spans the duration of the trial. Adjusted time aligns all trials to the same time axis to allow pooling of variable length epochs (see Methods). Task epochs as denoted by colored bar above. (c) Distribution of mean firing rates of putative single units over the session. (d) Proportion of single units displaying peak activity in each epoch, normalized to the mean duration of each epoch. (e–g) Example neurons showing (e) stimulus, (f) choice, and (g) outcome tuning within the respective epochs. Insets show mean normalized response amplitudes (z-scored activity) over all such selective neurons (black indicates preferred, blue indicates non-preferred, shaded area indicates SEM). (h) Proportion of visual location tuned cells in recording dataset. (i) Proportion of choice direction tuned cells. (j) Proportion of reward tuned cells. (k) Proportions of cells with significant modulation of activity (paired t test of epoch rates within trials, p < 0.05) during stimulus (s, green), movement (m, blue), or outcome (o, purple) epochs compared to pre-stimulus baseline (epoch 1 from panel b). (l) Proportion of all single units (n = 407) tuned to some combination of stimulus (s), choice (c), and outcome (o) across epochs. The underlying data for this figure are available for download from 10.17632/5ms7gcb67j.1.

