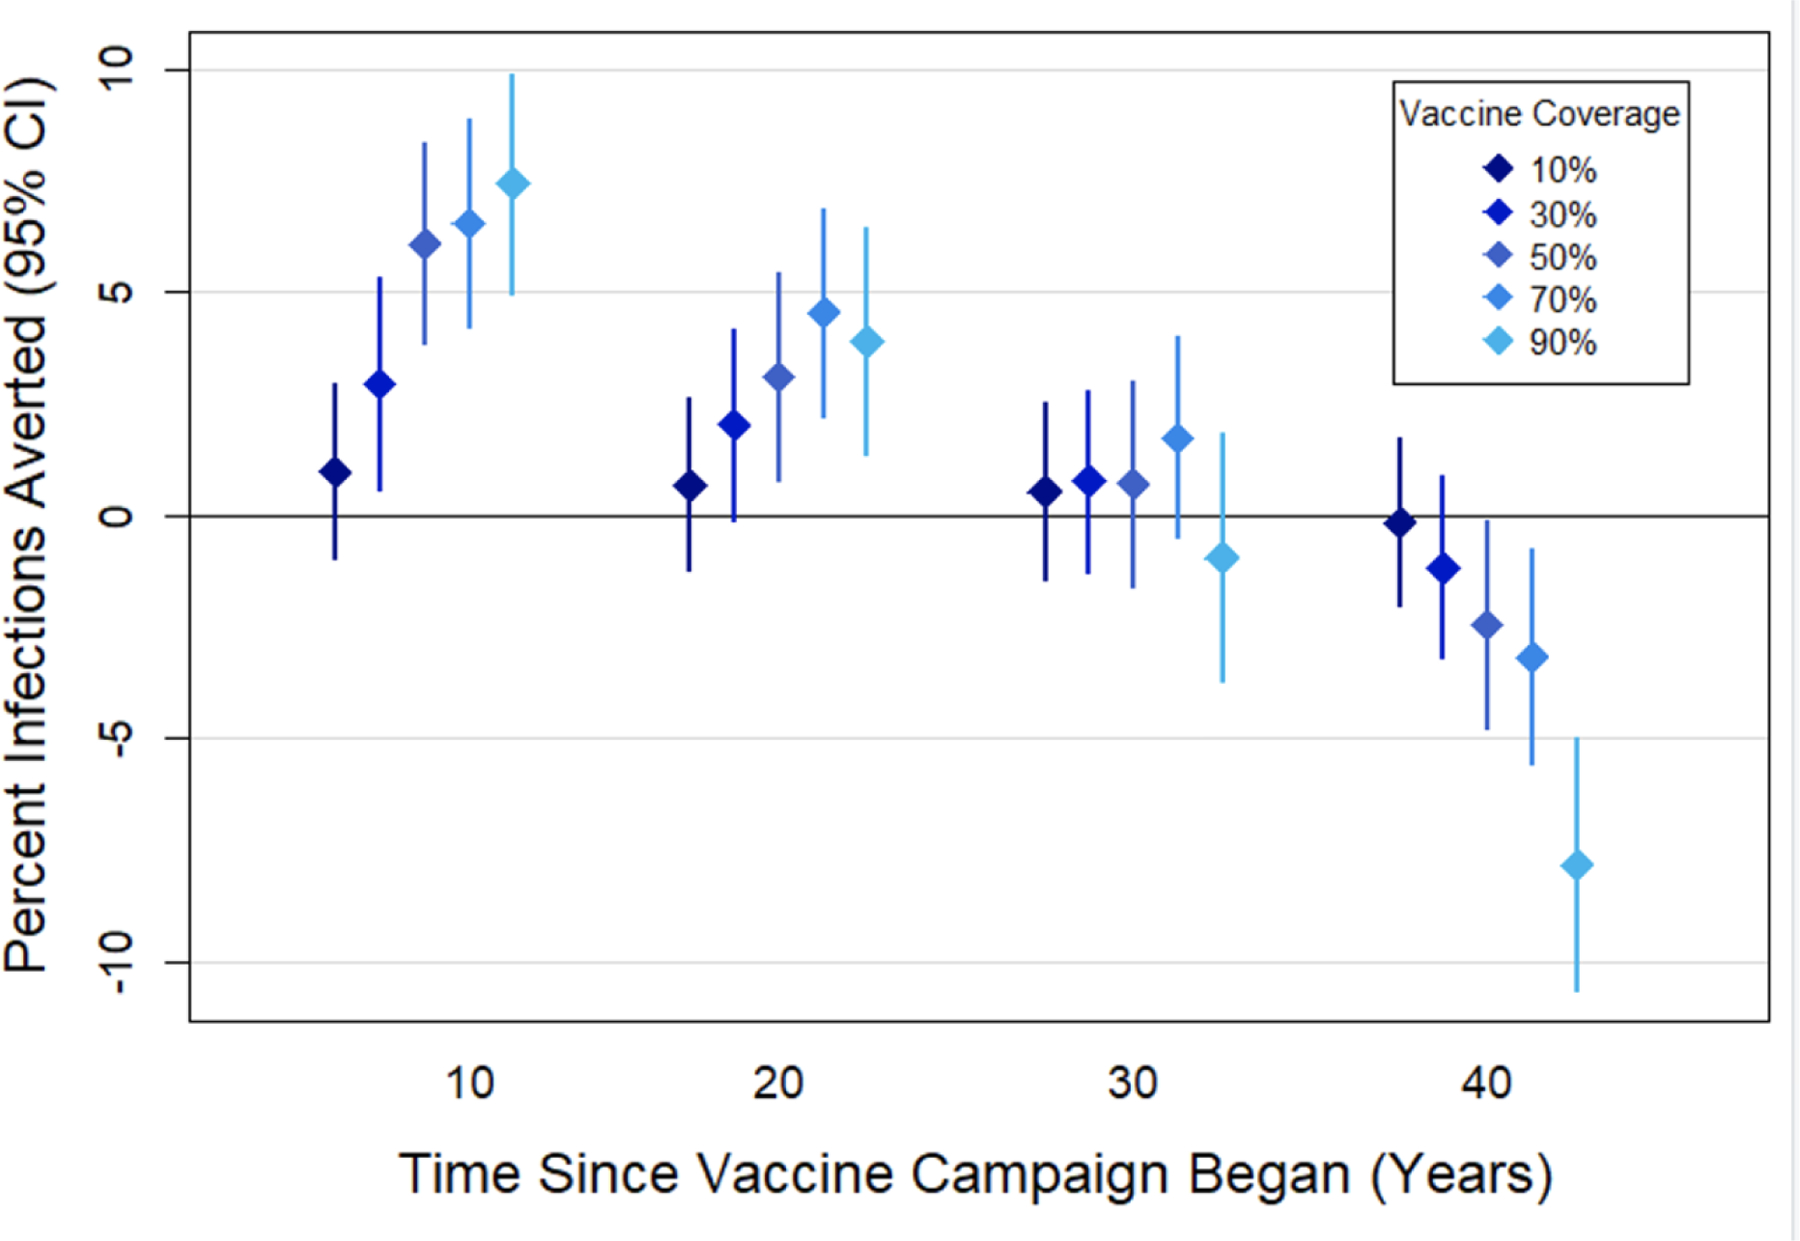
Figure 7. Proportion of infections averted due to a 1.0 log10 vaccine at varying coverage levels.

The mean proportion of cumulative infections averted by the vaccine relative to the no-vaccine scenario at varying coverage levels of a vaccine that reduced phenotypic SPVL by 1.0 log10 copies/ml. Bars represent 95% confidence intervals.
