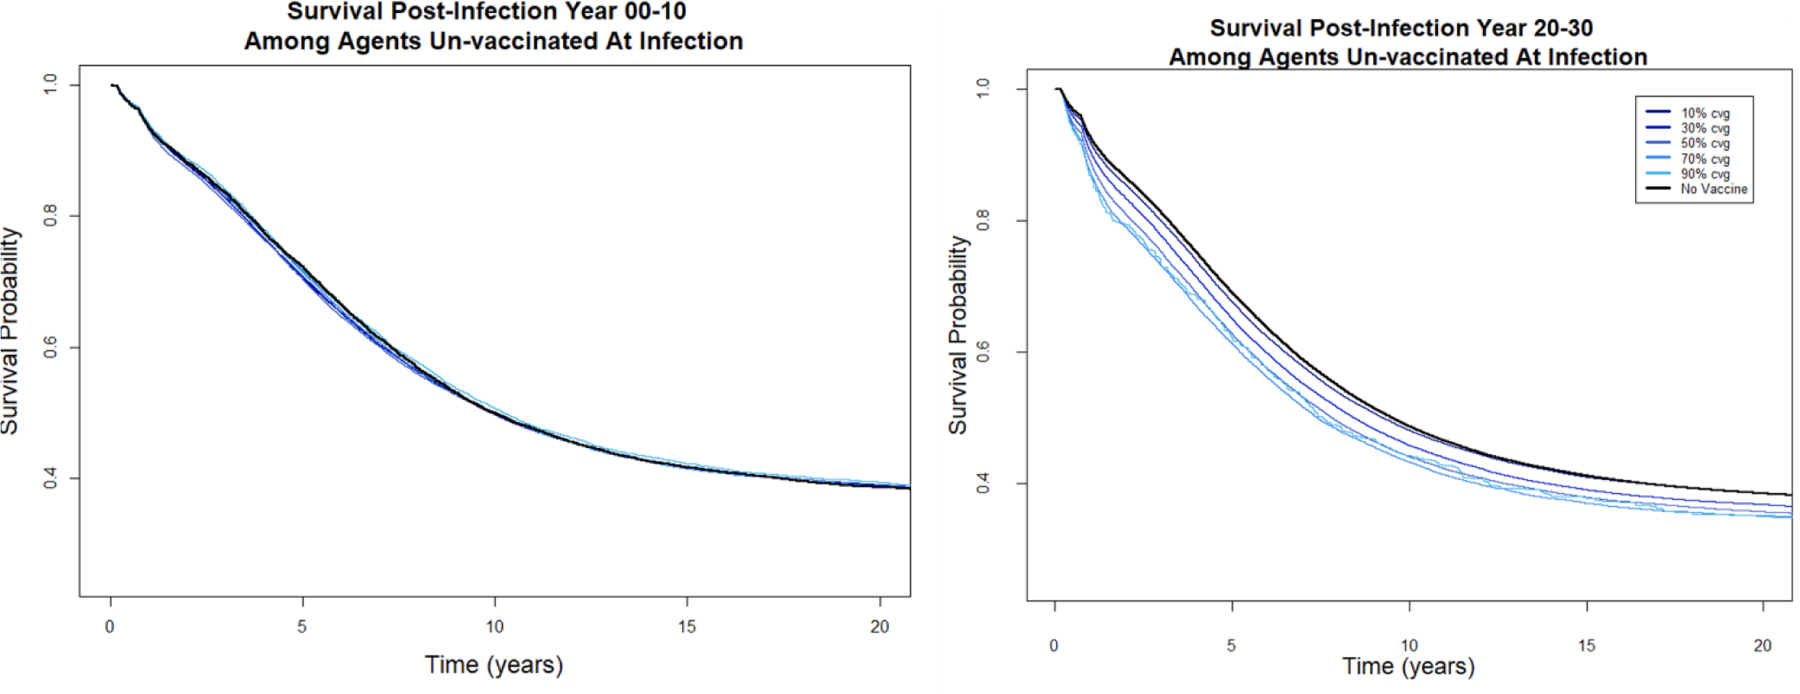
Figure 8. Kaplan-Meier survival curves for agents unvaccinated at infection in the first ten years of the vaccine campaign compared to the final 10 years.

First plot: survival among agents who became infected between year 0 and 10, with each line (overlapping and not distinguishable) representing survival under different coverage levels of a 1.0 log10 disease modifying vaccine. Second plot: survival among agents who became infected between year 20 and 30, with each line representing survival under different coverage levels of a 1.0 log10 disease modifying vaccine.
