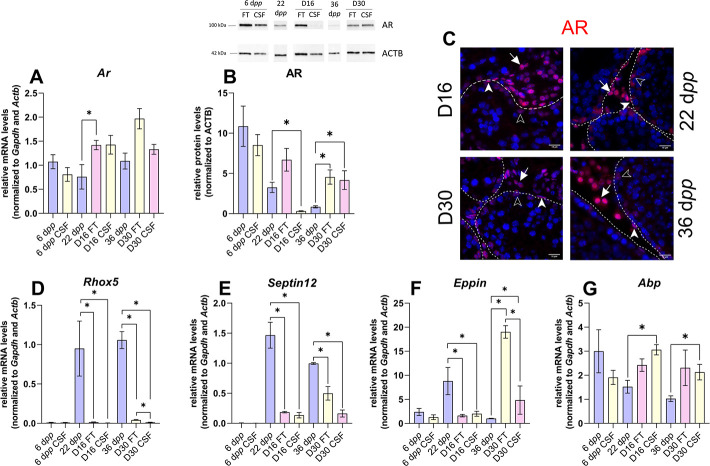
Figure 4. Androgen signaling is altered in 30 days organotypic cultures.
(A) Relative mRNA levels of Ar (normalized to Gapdh and Actb) and (B) relative protein levels of androgen receptor (AR) (normalized to ACTB) during mouse postnatal development (6 dpp, 22 dpp, and 36 dpp) and in in vitro cultured fresh testicular tissues (FT) or controlled slow freezing (CSF) tissues (D16 and D30). (C) Representative images of AR expression at 22 dpp and 36 dpp and at corresponding in vitro time points (D16 and D30). A representative image of a negative control is shown in Figure 2J (same secondary antibody as for CYP17A1). Testicular tissue sections were counterstained with Hoechst (blue). Solid arrowheads: peritubular myoid cells. Open arrowheads: Sertoli cells. Arrows: Leydig cells. Dotted lines delineate seminiferous tubules (ST). Scale: 15 µm. (D–G) Relative mRNA levels of Rhox5, Septin12, Eppin, and Abp (normalized to Gapdh and Actb). Data are presented as means ± SEM with n=4 biological replicates for each group. A value of *p<0.05 was considered statistically significant.

