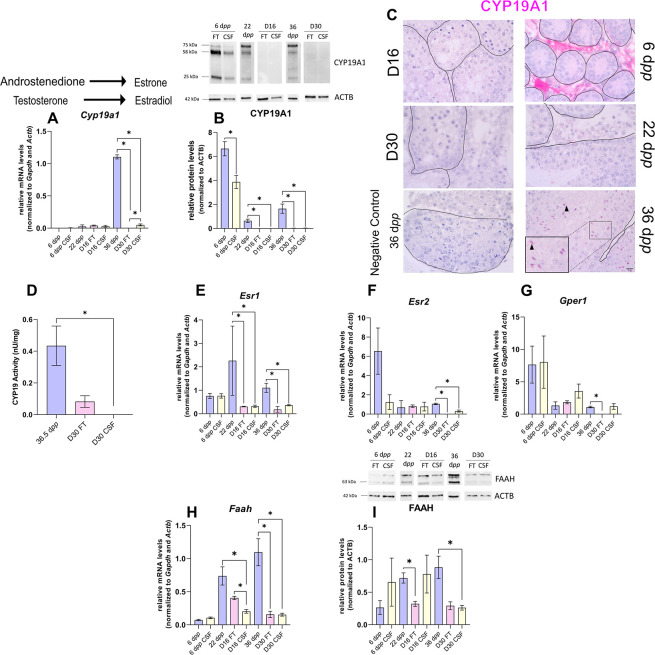
Figure 5. The expression of aromatase and estrogen signaling is impaired after 30 days of organotypic culture.
(A) Relative mRNA levels of Cyp19a1 (normalized to Gapdh and Actb) and (B) relative protein levels of CYP19A1 (normalized to ACTB) during mouse postnatal development (6 dpp, 22 dpp, and 36 dpp) and in in vitro cultured fresh testicular tissues (FT) or controlled slow freezing (CSF) tissues (D16 and D30). The bands on the western blot correspond to different isoforms of CYP19. (C) Representative images of CYP19A1 expression at 6 dpp, 22 dpp, and 36 dpp and at corresponding in vitro time points (D16 and D30). A representative image of a negative control, carried out by omitting the primary antibody, is also shown. Testicular tissue sections were counterstained with Hematoxylin. Scale: 15 µm. Arrow: Leydig cells. Arrowheads: elongated spermatids. (D) Aromatase activity (normalized to tissue weight). (E–G) Relative mRNA levels of Esr1, Esr2, and Gper1 (normalized to Gapdh and Actb). (H) Relative mRNA levels of Faah (normalized to Gapdh and Actb) and (I) relative protein levels of fatty acid amide hydrolase (FAAH) (normalized to ACTB). The second band at 80 kDa is an isoform of FAAH (Q8BRM1, UniProtKB). Data are presented as means ± SEM with n=4 biological replicates for each group. A value of *p<0.05 was considered statistically significant.

