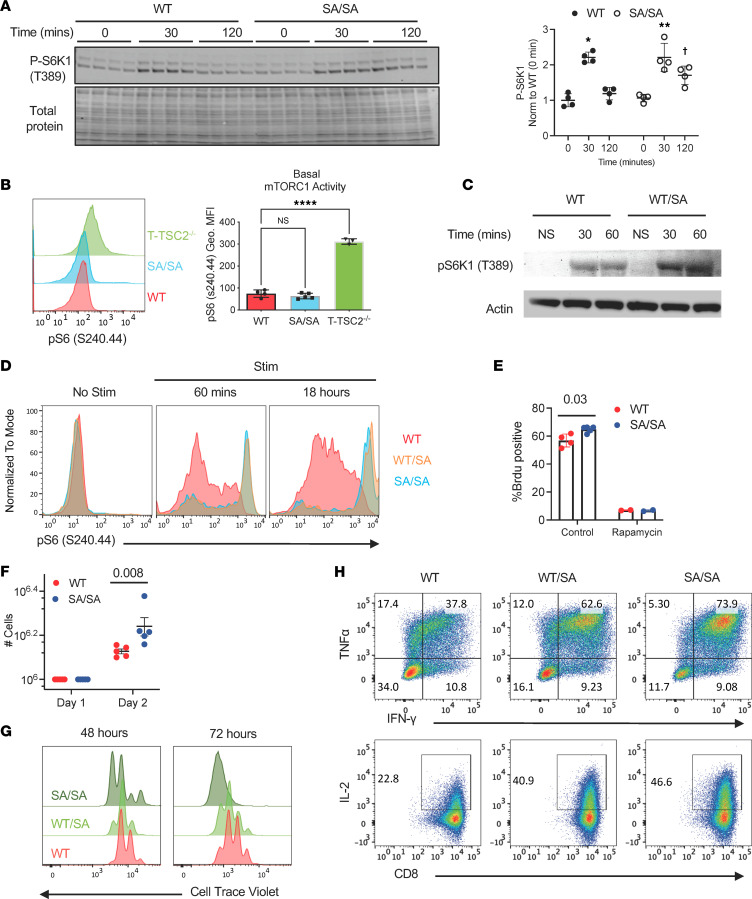
Figure 3. Mutating TSC2 at S1365 augments mTORC1 activity and function in murine CD8+ T cells upon stimulation.
(A) Immunoblot analysis of mTORC1 activity at baseline (time 0) and 0.5 and 2 hours after stimulation with αCD3/αCD28 in CD8+ T cells expressing WT or TSC2 SA/SA. Summary data to the right (n = 4/group); 2-way ANOVA, Sidaks multiple comparisons test: * P < 0.00003; ** P ≤ 0.003 versus Time 0, 120 min; †P = 0.012 versus WT at 120 min). (B) mTORC1 activity assessed by intracellular staining for mTORC1 activity via phospho-S6 levels in naive WT, TSC2 WT, SA/SA, or TSC2–/– CD8+ T cells. Geo-MFI, geometric mean fluorescence intensity. Summary data to right; n = 4, 5, 3 for groups left to right; 1-way ANOVA, ****P = 3 × 10–11, Holm-Šídáks multiple-comparisons test. (C) Example immunoblot for mTORC1 activation (pS6K-1) from similar experiment as in A but with TSC2 WT/SA CD8+ T cells. (D) Naive WT, WT/SA, and SA/SA CD8+ T cells stimulated with αCD3 and αCD28 to activate TCR signaling for 60 minutes and 18 hours and mTORC1 activity assessed by intracellular staining for mTORC1 activity via phospho-S6 levels. (E) WT and SA/SA CD8+ T cells stimulated with αCD3 and αCD28 with or without rapamycin to inhibit mTOR, and cell cycle entry assessed by BrdU+ staining by flow cytometry. n = 4 biologic replicates, 5 control, 2 rapamycin; P value Kruskal Wallis test. (F) Same experiment (without rapamycin) with cell counts measured after 24 and 48 hours. n = 5/group; significance found with Kruskal Wallis test. (G) WT, WT/SA, and SA/SA mutant OTI CD8+ T cells stimulated with OVA I peptide and cell proliferation analyzed by flow cytometry on day 2 and day 3 after activation. (H) CD8+ T cells from WT, WT/SA, and SA/SA genotypes, activated and expanded in IL-2, and then examined for cytokine analysis of IFN-γ, TNF-α, and IL-2 after restimulating with αCD3/αCD28. Data are representative of at least 2 independent experiments.

