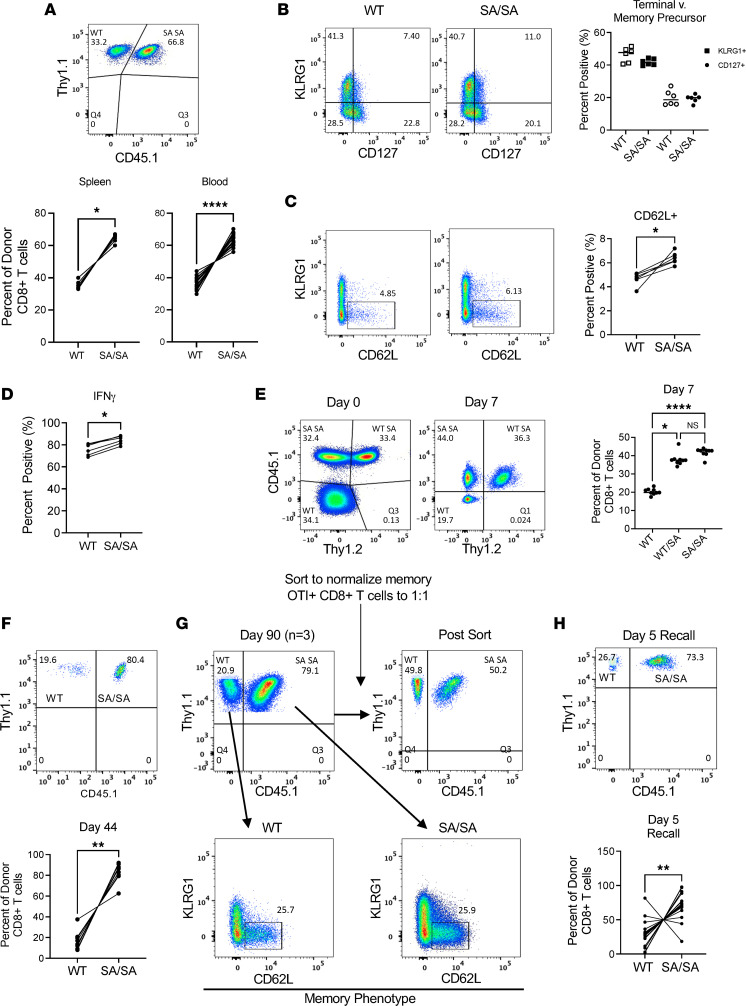
Figure 4. CD8+ T cells expressing TSC2 SA mutation have greater effector function while still preserving memory formation and recall capacity.
WT and mutant TSC2 SA/SA transgenic CD8+ T cells were coadoptively transferred (1:1) into naive WT hosts followed with acute pathogen infection. (A) Flow cytometry plot of transferred OTI CD8+ T cells (top) and summary data (bottom) showing percent of WT versus SA/SA genotype from donor population 8 days after exposure to LM-OVA in spleen (n = 6) and blood (n = 17). *P < 0.05, ****P < 0.0001 paired 2-tailed t test. (B–D) Phenotypic and functional analysis of donor WT and mutant TSC2 SA/SA CD8+ T cells during acute infection from A. * P < 0.05, n = 6. (E) Triple coadoptive transfer of WT, WT/SA, or SA/SA TSC2 OTI CD8+ T cells into mice then infected with LM-OVA with relative number of cells in each group identified 1 week later. n = 9/group; *P < 0.05, ****P < 0.0001, 1-way ANOVA, Sidak’s multiple-comparison test. (F) Percent present of donor WT versus mutant TSC2 SA/SA CD8+ T cells 44 days after injection (blood, memory phase). n = 9; **P = 0.004, Wilcoxon 2-tailed signed-rank test. (G) Naive mice received equal cotransfer of memory OTI CD8+ WT or SA expressing T cells for recall with LM-OVA. At day 90, the percent of memory WT and mutant TSC2SA OTI CD8+ T cells in spleen (top, combined n = 3) and characterized based on KLRG1 (–) and CD62L (+) for memory phenotype (lower panels). These sorted memory CD8+ T cells were then injected in equal numbers (1:1) to naive WT recipients (top, right) who were subsequently infected with LM-OVA to assess memory recall ability. (H) After 5-days after infection, graphical summary of donor WT and SA/SA CD8+ T cells in spleen. **P = 0.003 Wilcoxon, n = 16. Data are representative of at least 3 independent experiments except E, with 2.

