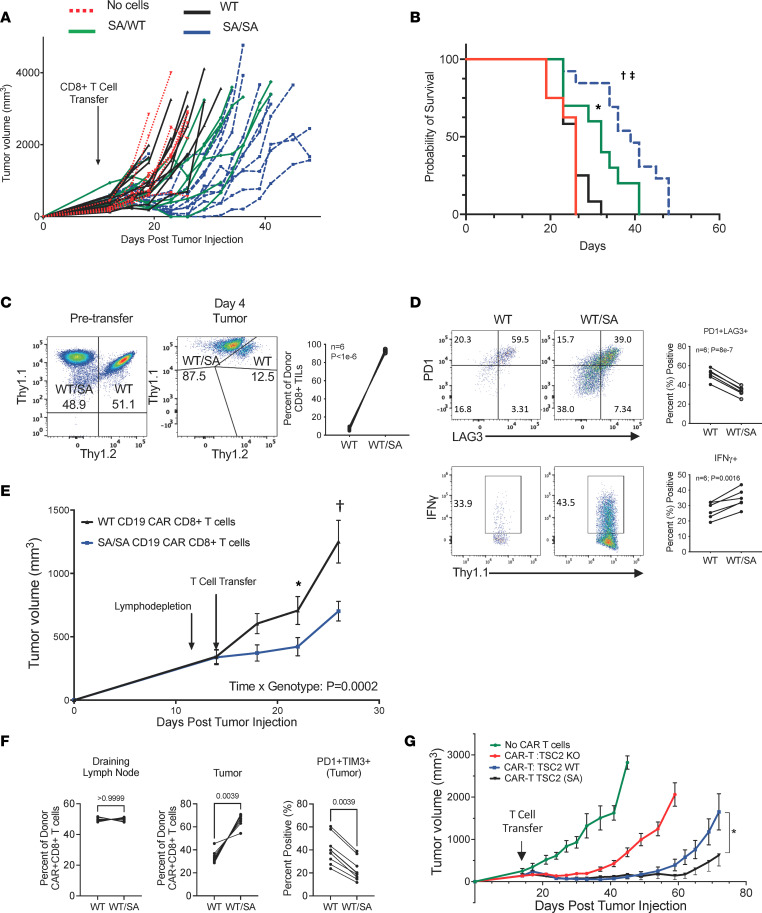
Figure 6. TSC2 SA CD8+ T cells promote strong anti-tumor immunity with adoptive T cell therapy.
(A) WT mice with B16-melanoma OVA cells received preactivated WT (n = 12), TSC2 WT/SA (n = 10) or SA/SA (n = 13) OTI CD8+ T cells (or no cell controls, n = 8). Tumor volume was assessed every 2-3 days. (B) Survival curves with Mantel-Cox test for differences. Mice receiving TSC2 WT/SA and SA/SA CD8+ T cells had better survival over TSC2-WT (P=0.0085 and 1.7e-5, respectively) with some dose dependence (WT/SA versus SA/SA P=0.027). (C) Left: Equal number of activated WT and TSC2 (SA) heterozygous OTI+ CD8+ T cells co-transferred to same B16-melanoma OVA bearing host. Middle: Relative counts of TSC2 WT or WT/SA CD8+ T cells by flow cytometry in tumor. Right: summary data; P values for paired t-test. (D) Exhaustion profile (top) and function (bottom) of donor TSC2 WT or WT/SA CD8+ from these tumors. Quadrant numbers are percent cells in each; summary on right, paired T-test. (E) Murine CD19 CAR-T model targeting B16 tumors expressing human CD19. Growth curves until first sacrifice (WT n = 15 and SA/SA n = 16). Interaction of time and TSC2 genotype determined by 2W repeated measures ANOVA. Sidak’s multiple comparisons test: *P=0.07, †P=0.00002 between curves. (F) Similar experiment as in 6E, CAR-T cells tumor (day 8) were majority WT/SA displaying less exhaustion. WT and WT/SA CAR-T cells similar in draining lymph node. Wilcoxon, n = 9-10. (G) CAR-T experiment using human CD70 CAR-T cells against CD70 expressing human small cell lung tumor (NCI-H1975) in NSG mice (No cells n = 4, control n = 12, TSC2KO n = 12, TSC2 (SA) n = 12). *P=0.00006 for interaction of time and TSC2 genotype comparing TSC2 WT to SA. Data are representative of at least 2 independent experiments.

