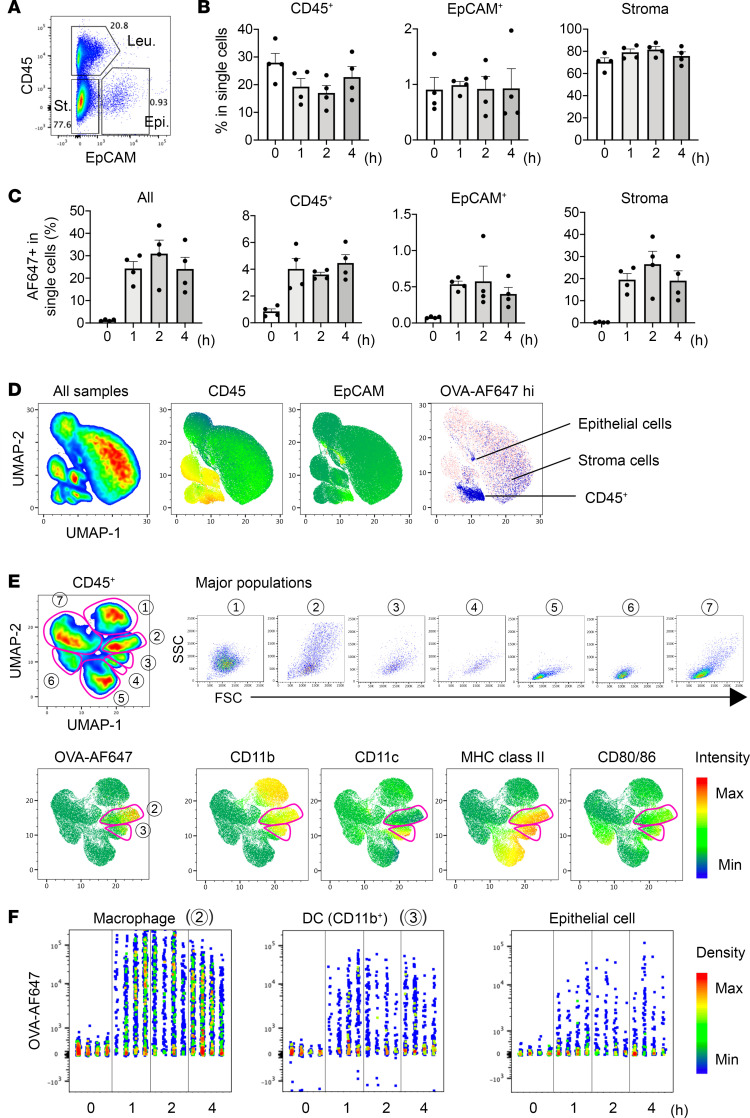
Figure 2. Kinetics and cell populations for antigen uptake.
(A) Frequencies of the pooled dispersed conjunctival cell populations. Leu, leukocytes; Epi, epithelial cells; St, stromal cells. (B and C) Kinetics of the frequencies of indicated cell populations (B) and those of indicated cell populations that are OVA-AF647 positive (C) (n = 4, each time point). Data are shown as mean ± SEM (B and C). (D) Unsupervised clustering of the conjunctival cells. The expression levels of CD45 and EpCAM are shown in heatmaps. OVA-AF647–high cells are shown in blue. (E) Unsupervised clustering of the CD45+ cells revealed 7 distinct populations with differential forward- and side-scatter distributions. The expression levels of the indicated markers are shown in heatmaps. (F) Kinetics of OVA-AF647 uptake by the indicated cell populations (n = 4, each time point). B6 mice were used for all experiments.

