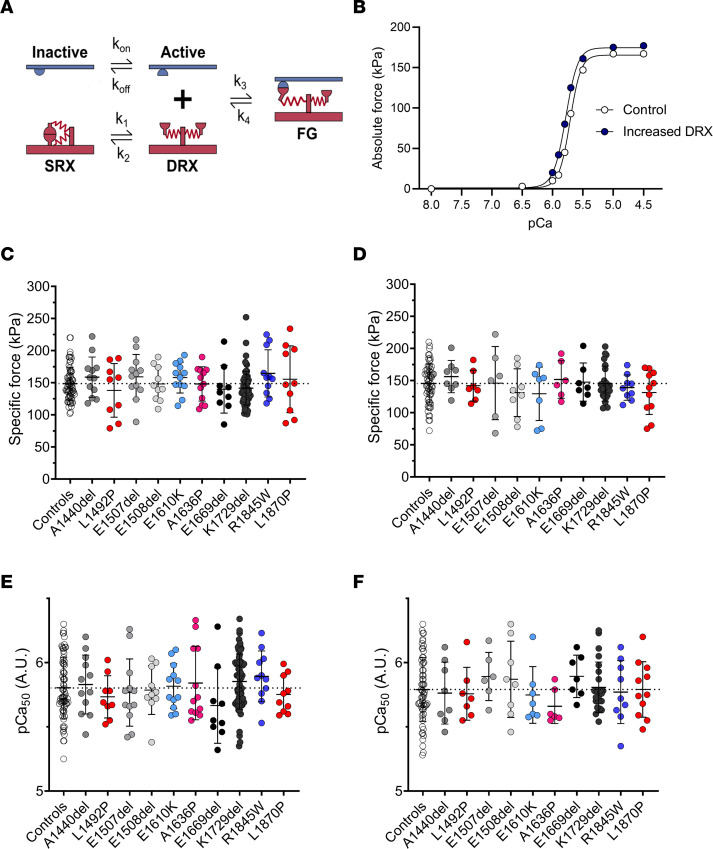
Figure 7. Modeling and experimental cellular force production.
(A) The 3-component model used for our simulation from ref. 26 with SRX, DRX, and FG (force-generating) states. (B) The result of the simulations. Experimental specific force and Ca2+ sensitivity for muscle fibers isolated from controls (CTL) or from patients with MYH7 (MYH7) or with MYH2 (MYH2) mutations. Data are separated according to the myosin heavy chain expression of individual fibers: either β/slow (graphs C and E) or type IIA (graphs D and F). For the β/slow isoform, n = 72 were from CTL and n = 161 were from patients. For the type IIA isoform, n = 64 were from CTL and n = 92 were from patients. Mean ± SD appear on the graphs. The 1-way ANOVA with Dunnett’s test post hoc correction was used, but no significant differences were seen.

