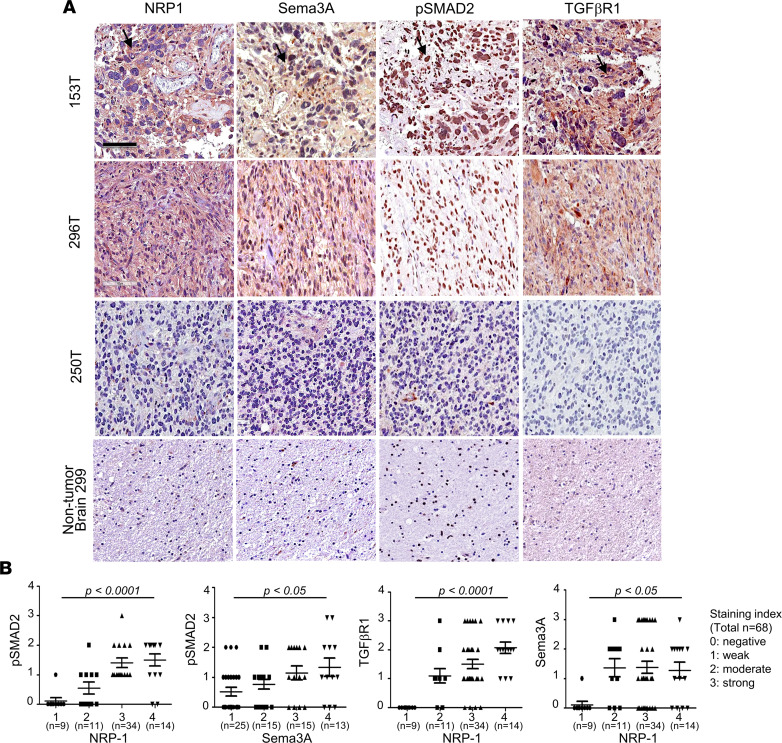
Figure 8. Expression of Sema3A/NRP1 signaling components in GBM.
(A) Representative IHC images of NRP1, Sema3A, p-SMAD2, and TGF-βR1 using 3 GBM specimens — 153, 296, and 250 — and a nontumor brain tissue. Brown staining indicates immunopositivity for the indicated Ab. Scale bar: 100 μm. (B) Correlations between the expression levels of each of the Sema3A/NRP1 signaling components. Staining intensity of each IHC using Abs against NRP1, Sema3A, p-SMAD2, and TGF-βR1 in GBM specimens (n = 68) was determined and grouped: 0, negative; 1, weak; 2, moderate; 3, strong; and 4, very strong. Data are represented as vertical scattered plots using GraphPad Prism. Average intensity and SD are shown for the indicated Ab. P values were obtained using 2-way ANOVA.

