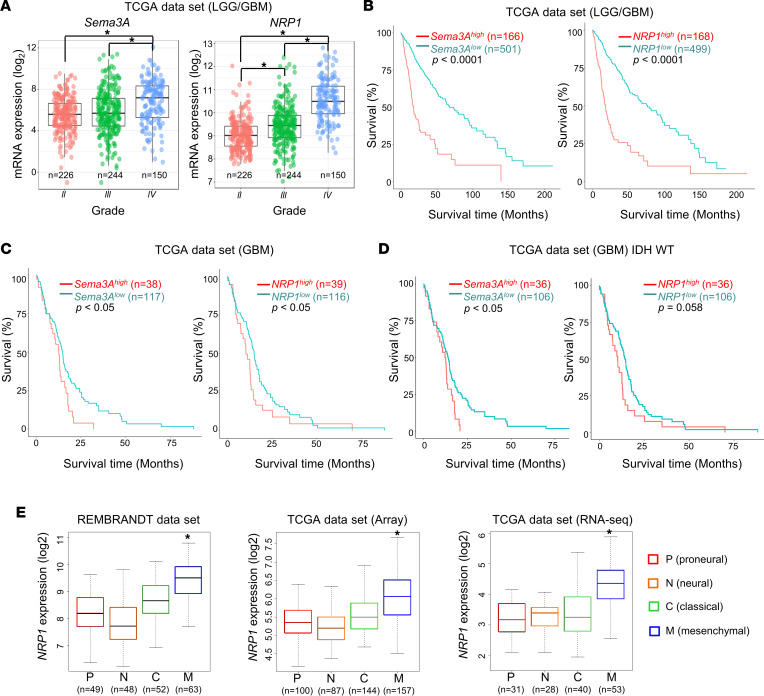
Figure 9. Association between Sema3A/NRP1 levels and survival of patients with glioma and GBM subtype.
(A) Box-and-whisker plots showing mRNA levels of Sema3A and NRP1 in LGG and GBM specimens in TCGA data set (n = 620). *P < 0.0001 by pairwise t test. (B) Kaplan-Meier survival curves of patients with LGG and GBM (n = 667) based on the expression levels of Sema3A or NRP1 mRNA. High and low subgroups were operationally defined as the upper quartile (top 25%) and the rest, respectively. *P < 0.0001 by log-rank analysis. (C and D) Kaplan-Meier survival curves of patients with GBM and the WT IDH1/2-containing GBMs based on the levels of Sema3A or NRP1 mRNA. *P < 0.05 by log-rank analysis. (E) Box-and-whisker plots of NRP1 mRNA expression in 4 representative GBM subtypes. Repository of Molecular Brain Neoplasia Data (REMBRANDT) and TCGA (microarray data and RNA-Seq data sets, separately) databases were used to determine NRP1 mRNA levels in each subtype of GBM. *P < 0.01 (mesenchymal subtype vs. other subtypes) by 1-way ANOVA with Tukey’s multiple-comparison test.

