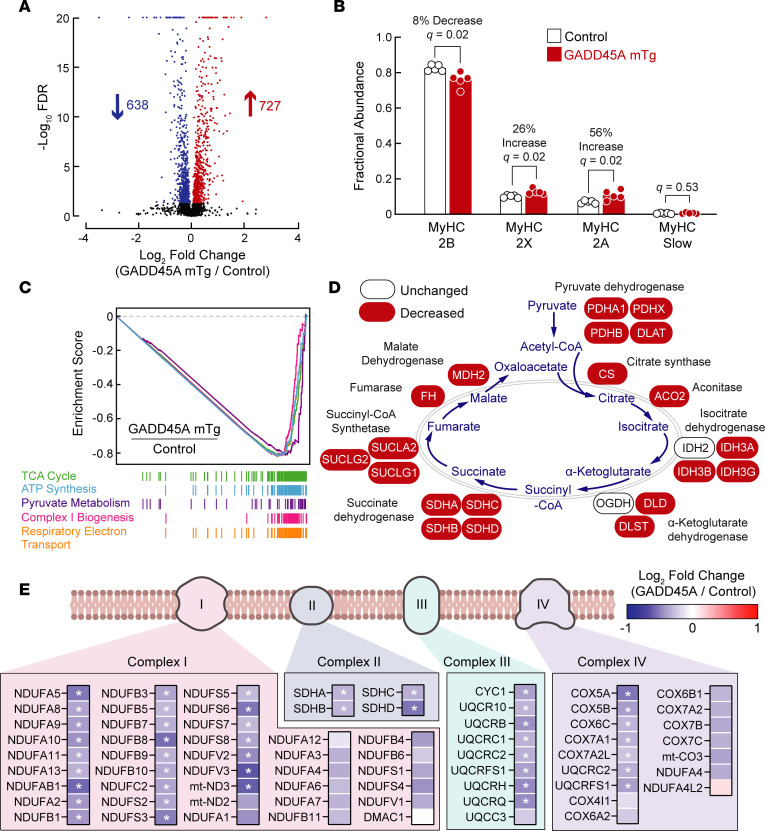
Figure 5. GADD45A reduces levels of numerous proteins that are required for oxidative metabolism in skeletal muscle.
Protein from quadriceps muscles of 15-month-old male littermate control and GADD45A-mTg mice was subjected to TMT labeling and mass spectrometry, followed by quantification of the relative abundance of 5,206 proteins. Data are from 5 muscles per genotype. (A) Volcano plot showing log2 fold-changes of all identified proteins in GADD45A-mTg muscles relative to levels in control muscles versus statistical significance of those changes. At FDR < 0.05, levels of 638 proteins were decreased in GADD45A-mTg muscles, and levels of 727 proteins were increased. Complete proteomic data are shown in Supplemental Table 1. (B) Fractional abundance of MyHC-2B, MyHC-2X, MyHC-2A, and MyHC-slow, calculated from data in Supplemental Table 2. Each data point represents the value from 1 muscle, and bars indicate mean values. q values were determined with multiple unpaired 2-tailed t tests. (C) Enrichment plots of the 5 most significantly affected Reactome pathways, based on gene set enrichment analysis (GSEA) of the proteomic data. All 5 pathways were downregulated with FDR < 10–5. Complete GSEA results are shown in Supplemental Table 3. (D) Schematic illustrating detected proteins involved in the TCA cycle and effect of GADD45A on levels of those proteins. GADD45A significantly decreased 20 of the 22 detected proteins (FDR < 0.05). (E) Schematic of mitochondrial electron transport chain complexes I, II, III, and IV, with an underlying heatmap showing detected proteins in those complexes, and the effect of GADD45A on levels of those proteins. Asterisks indicate FDR < 0.05.

