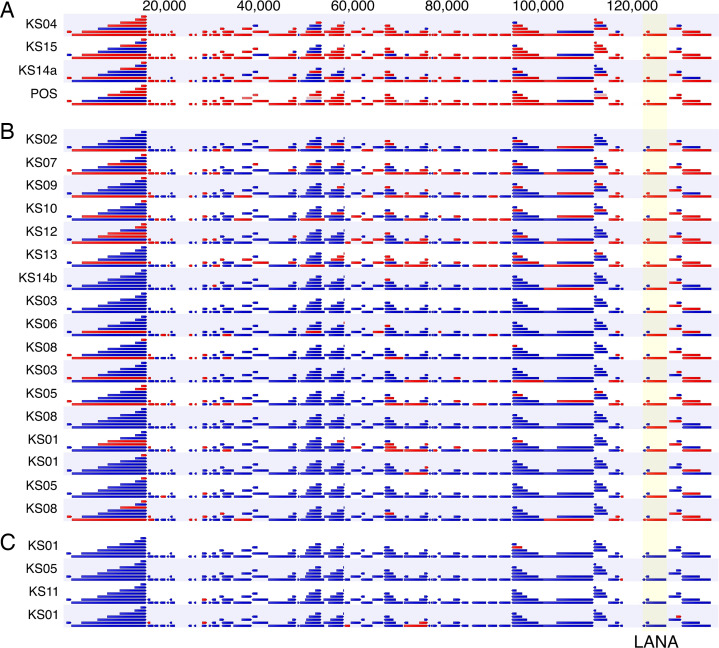
Figure 3. Viral RNA-Seq analysis of pediatric KS biopsies.
RNA-Seq analysis of 25 pediatric KS biopsies; samples were grouped based on LANA expression. Red indicates transcripts are present, and blue indicates genes are absent. The numbers on top represent genome coordinates. Samples PEDKS01, PEDKS03, PEDKS05, and PEDKS08 had multiple libraries made and analyzed separately but were merged prior to performing human RNA-Seq analysis. PEDKS14a and PEDKS14b represent 2 different biopsies on the same participant. Positive (POS) is reactive BCBL-1 cell line RNA. Letters A–C indicate transcription clusters.

