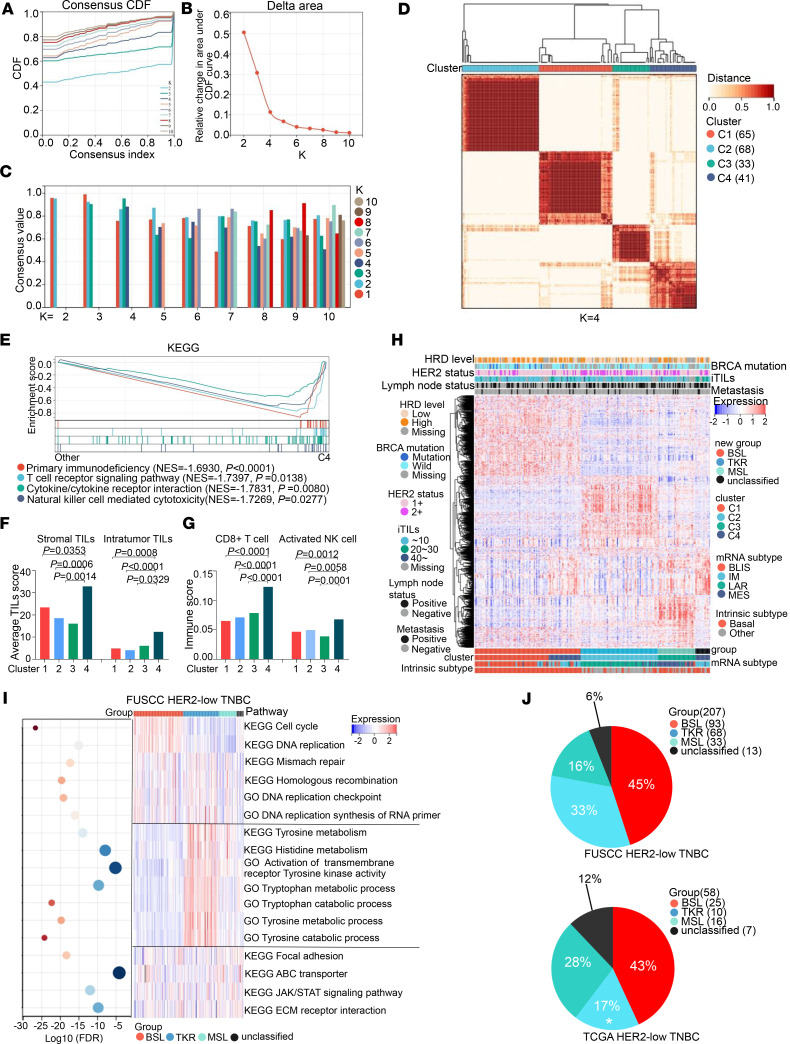
Figure 1. Transcriptomic profiling reveals HER2-low TNBC subgroups.
(A) Consensus empirical cumulative distribution function (CDF) curves of K = 2–10. (B) Delta area changes with K = 2–10. (C) Consensus values of different K values. (D) Consensus clustering matrices of the 207 HER2-low TNBC samples with mRNA expression at K = 4. (E) Gene set enrichment analysis (GSEA) of primary immunodeficiency, T cell receptor signaling pathway, cytokine/cytokine receptor interaction, and NK cell–mediated cytotoxicity between C4 and other clusters based on the KEGG data set (permutation test). (F) Average stromal and intratumoral TIL scores in the 4 subgroups (Kruskal-Wallis test followed by Dunn’s multiple comparisons test). (G) Relative abundance of 2 immune-activated cells in 4 subgroups based on CIBERSORT (1-way ANOVA followed by Dunnett’s t test). (H) Heatmap showing the top 2,000 variable mRNAs of 207 HER2-low TNBC samples; clinical and molecular features are annotated. (I) ssGSEA of 207 HER2-low TNBC samples based on KEGG and GO data sets are shown in the heatmap, and the FDRs are shown in the bubble plot. (J) Distribution of HER2-low TNBC mRNA subgroups in the FUSCC (top) and TCGA (bottom) data sets (χ2 test). The samples of A–I were from HER2-low TNBC based on the FUSCC data set. Statistical significance was set at P < 0.05.

