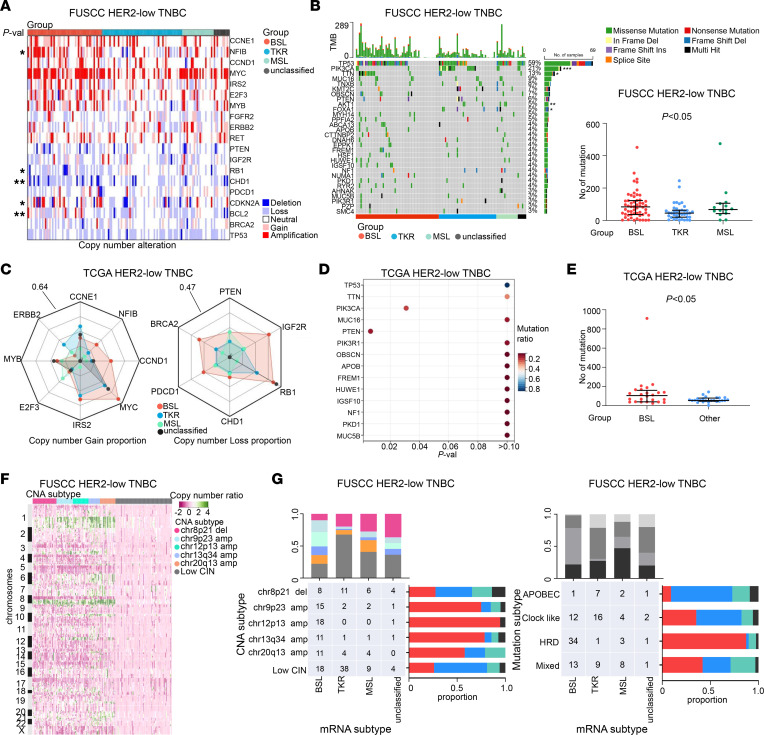
Figure 2. HER2-low TNBC subgroups based on multiomics data have distinct features.
(A) Specific oncogenes and tumor suppressor genes (TSGs) with top-rank GISTIC peaks. (B) The top 30 genes with the most frequent mutations (at least 3% of the cases; left) and total mutation numbers among the BSL, TKR, and MSL subgroups (right; Kruskal-Wallis test). (C) Radar chart illustrating the proportion of copy number gain (left) and loss (right) of specific oncogenes and TSGs. (D) Genes with the most frequent mutations (at least 3% of the cases). (E) Total mutation numbers between BSL and other groups (Mann-Whitney test). (F) Copy number–based clustering on the basis of GISTIC peaks is shown in the heatmap. (G) Relationships between mRNA subgroups and CNA subtypes (left) and mRNA subgroups and mutation subtypes (right). The samples for the data reported in A, B, F, and G were from FUSCC data set; those for C–E were from TCGA data set. Statistical significance was set at P < 0.05. *P < 0.05, **P < 0.01, ***P < 0.001. CIN, low chromosomal instability; Del, deletion; Ins, insertion; Multi, multiple; Val, value.

