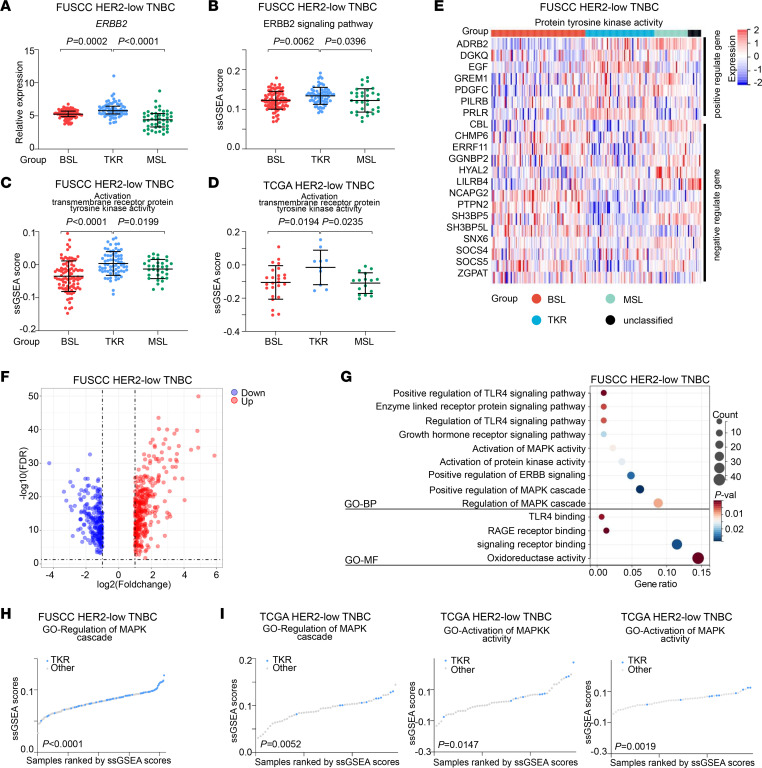
Figure 3. Activated ERBB2-mediated receptor tyrosine kinase in the TKR subgroup.
(A) Relative expression of ERBB2 among the BSL, TKR, and MSL subgroups (Kruskal-Wallis test followed by Dunn’s multiple comparisons test). (B) GO-ERBB2 signaling pathway ssGSEA scores among the BSL, TKR, and MSL subgroups. (C and D) GO activation transmembrane receptor protein tyrosine kinase activity ssGSEA scores among the BSL, TKR, and MSL subgroups from the FUSCC (C) and TCGA (D) data sets. (B–D) One-way ANOVA followed by Dunnett’s t test. (E) Expression levels of protein tyrosine kinase activity–related genes across the mRNA subgroups (upper, positively regulated genes; lower, negatively regulated genes). (F) Volcano plot illustrating DEGs between the TKR subgroup and the other subgroups. (G) GO Biological Process (GO-BP) and GO Molecular Function (GO-MF) pathways were enriched on the basis of upregulated DEGs in the TKR subgroup (hypergeometric test). (H) GO regulation of MAPK cascade ssGSEA scores between TKR and other subgroups in HER2-low TNBC from the FUSCC data set. (I) GO regulation of MAPK cascade (left), GO activated MAPKK activity ssGSEA scores (middle), and GO activated MAPK activity ssGSEA scores (right) between TKR and other subgroups in HER2-low TNBC from the TCGA data set. (H and I) Student’s t test. Statistical significance was set at P < 0.05.

