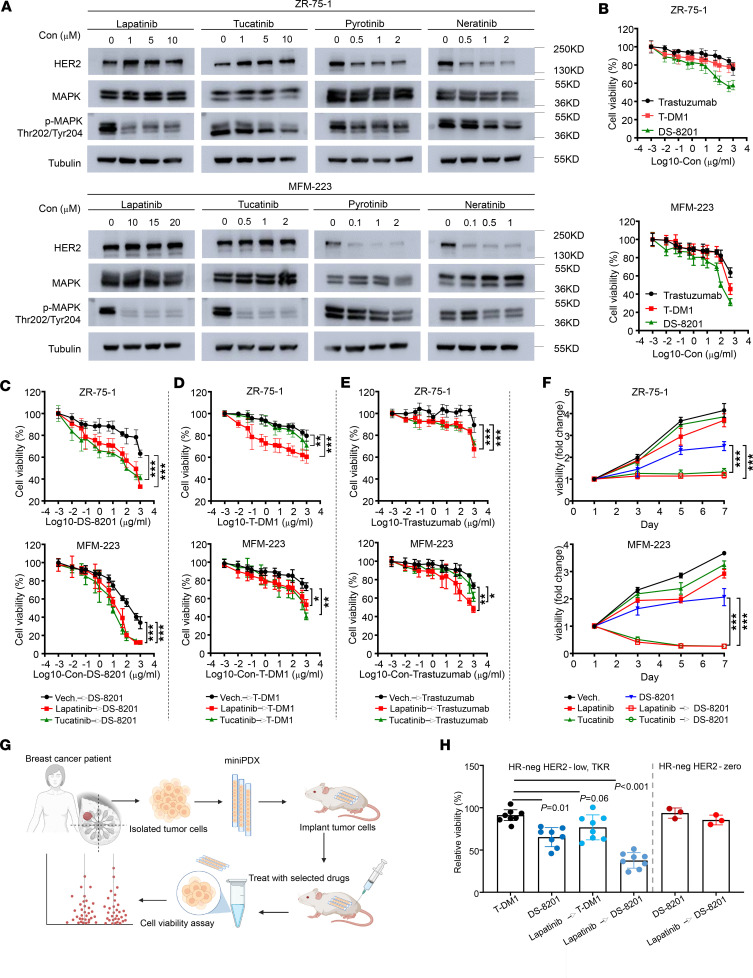
Figure 4. HER2/MAPK pathway activation in the TKR subgroup and treatment relevance.
(A) Western blot showing HER2, p-MAPK (Thr202/Tyr204), total MAPK, and tubulin (loading control) expression in total lysates of both ZR-75-1 (top) and MFM-223 (bottom) cells treated for 48 hours with lapatinib, tucatinib, pyrotinib, and neratinib at different concentrations. Untreated cells served as controls. (B) Cell Counting Kit-8 (CCK-8) assay was used to measure the cell viability of ZR-75-1 (n = 7) and MFM-223 (n = 6) cells in vitro. The cells were treated with serial concentrations of trastuzumab, T-DM1, and DS-8201 for 48 hours. (C) The CCK-8 assay was used to measure cell viability of ZR-75-1 cells (n = 7) against lapatinib (1 μM), tucatinib (1 μM), or Vech. for 48 hours and sequential treatment of DS-8201 for 48 hours (top) and MFM-223 cells (n = 6) against lapatinib (10 μM), tucatinib (1 μM) or Vech. for 48 hours and sequentially treated DS-8201 for 48 hours. Each point represents the mean and SD. (D) Sequential treatment of T-DM1. (E) Sequential treatment of trastuzumab. (F) CCK-8 assay of ZR-75-1 (top) and MFM-223 (bottom) cells against lapatinib, tucatinib, or Vech. and sequential treatment of DS-8201. Each point represents the mean and SD (n = 6). (G) Scheme of the generation of the miniPDX models for the in vivo pharmacological tests. (H) Relative viability of miniPDX models with different treatment strategies, as normalized to saline treatment. HER2-low TKR group, n = 8; pure TNBC (with HER2-0) group, n = 3 (1-way ANOVA followed by Dunnett’s t test). Data are presented as mean and SD. Statistical significance was set at P < 0.05. *P < 0.05, **P < 0.001, ***P < 0.001. Con, concentration; Neg, negative.

