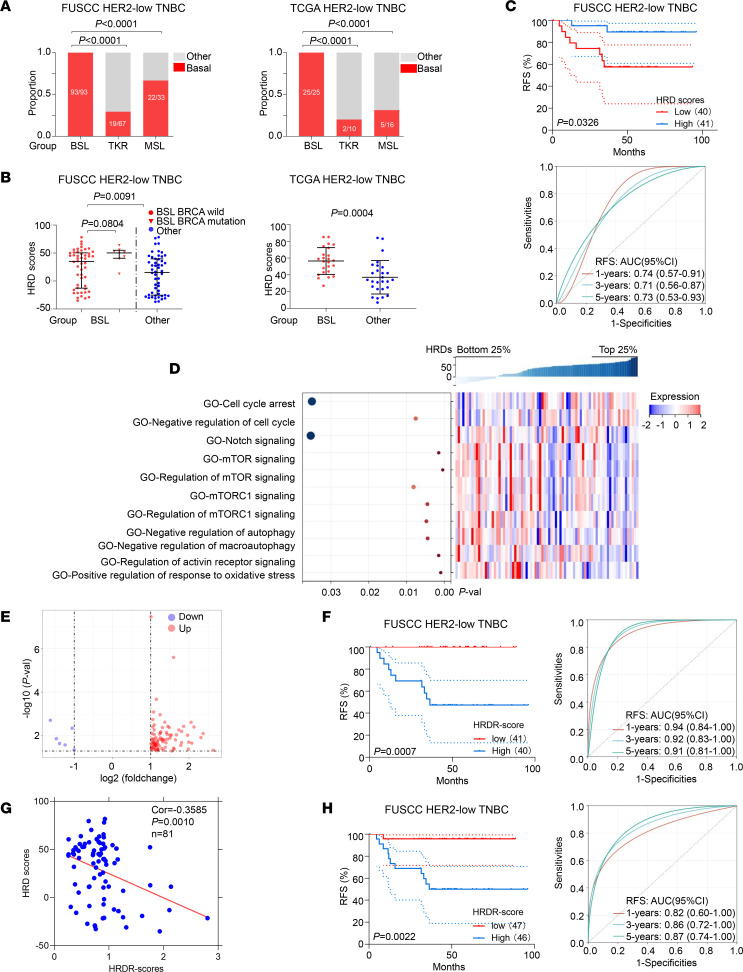
Figure 5. Construction of the HRD signature in the BSL subgroup to predict prognosis.
(A) Distribution of intrinsic BSL subtypes among the BSL, TKR, and MSL subgroups of HER2-low TNBC from the FUSCC (left) and TCGA (right) data sets (χ2 test and Fisher’s exact test). (B) Distribution of HRD scores in BSL and other subgroups with BRCA mutation status from the FUSCC data set (left; Mann-Whitney test); distribution of HRD scores in BSL and other subgroups from the TCGA data set (right; Student’s t test). (C) RFS of BSL patients in the high-HRD versus low-HRD groups (top; log-rank test); AUC of time-dependent ROC analysis (bottom). (D) ssGSEA of the BSL subgroup of HER2-low TNBC based on GO data sets are shown in the heatmap. (E) Volcano plot illustrating DEGs between the bottom 25% and top 25% of HRD scores in BSL. (F) RFS of BSL patients (with HRD scores) with high HRDR score versus low HRDR score groups (left; log-rank test); AUC of time-dependent ROC analysis (right). (G) Correlational analysis was performed between HRDR scores and HRD scores in BSL based on the FUSCC data set. (H) RFS of total BSL patients (with and without HRD scores) with high HRDR score versus low HRDR score groups (left; log-rank test); AUC of time-dependent ROC analysis. Statistical significance was set at P < 0.05. Val, value.

