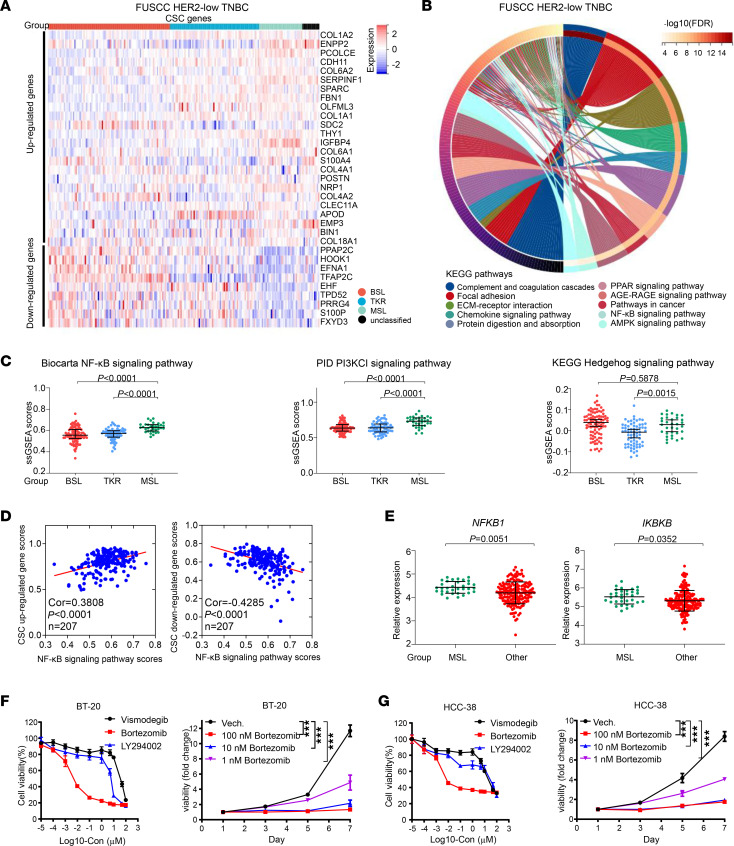
Figure 6. Upregulated NF-κB signaling pathway in the MSL subgroup and treatment relevance.
(A) Expression of breast CSC genes in HER2-low TNBC. (B) Chord plot depicting the relationship between DEGs in MSL subgroups and signaling pathways from the KEGG data set (hypergeometric test). (C) ssGSEA scores of the Biocarta NF-κB (left), PID PI3KCI (middle), and KEGG Hedgehog (right) signaling pathways among the BSL, TKR, and MSL subgroups (Kruskal-Wallis test followed by Dunn’s multiple comparisons test). (D) Spearman’s correlational analysis was performed between NF-κB signaling pathway ssGSEA scores and CSC upregulated (left), downregulated (right) gene scores in HER2-low TNBC. (E) Expression of NFKB1 (left) and IKBKB (right) between MSL and other subgroups (Mann-Whitney test). (F and G) The CCK-8 assay was used to measure in vitro cell viability of BT-20 (F; left) and HCC-38 (G; left) cells, which were treated with serial concentrations of CSC-related inhibitors (vismodegib, bortezomib, and LY294002) for 48 hours; after 48 hours, they were incubated with bortezomib (0 nM, 1 nM, 10 nM, and 100 nM). CCK-8 assay results for BT-20 (F; right) and HCC-38 (G; right) cells. Each point represents the mean and SD (n = 6). Statistical significance was set at P < 0.05. ***P < 0.001. Cor, correlation; ECM, extracellular matrix.

