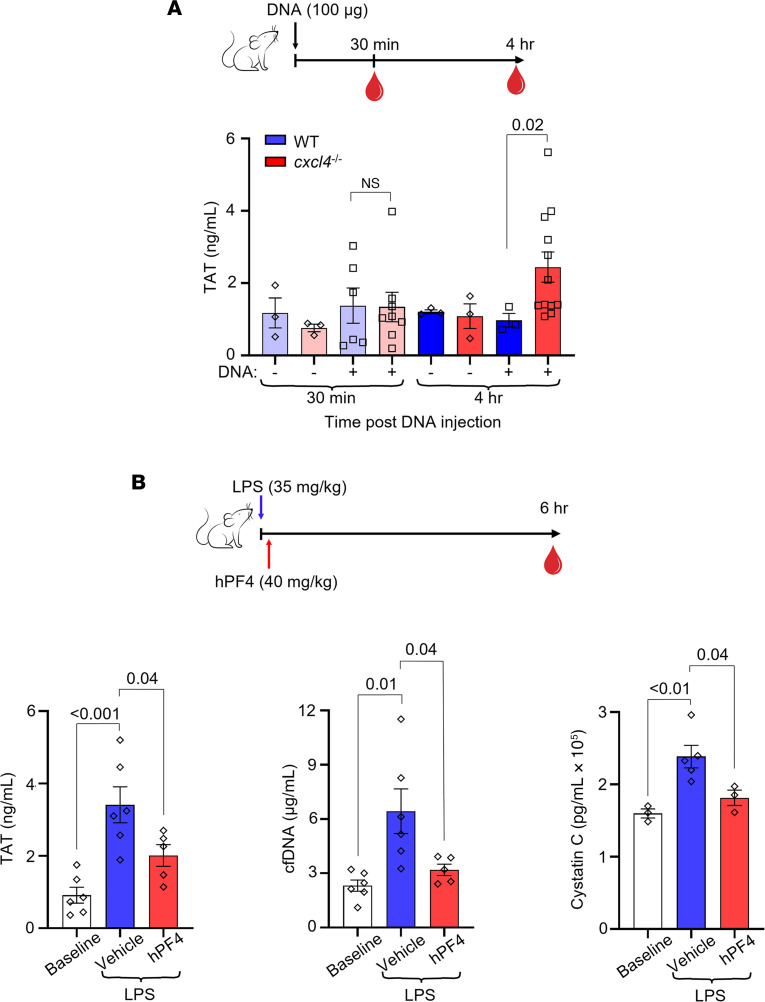
Figure 5. hPF4 attenuates cfDNA-induced coagulability and organ damage in vivo.
(A) Top: Schematic of study in which WT mice or Cxcl4–/– littermates were given normal saline vehicle or normal saline containing digested DNA prior to blood collection at 30 minutes or 4 hours. Bar graph: TAT levels using a commercial ELISA kit in platelet-poor plasma. Data are mean ± SEM of at least 3 independent experiments. (B) Top: Schematic of study in which WT mice received normal saline vehicle or LPS, and a subset of animals was given hPF4 by tail vein injection immediately following LPS injection. TAT, cfDNA, and cystatin C levels were measured in blood drawn at baseline and 6 hours after LPS with and without hPF4 infusion. Bar graphs: TAT levels (left), cfDNA levels (middle), and cystatin C levels (right) 6 hours after LPS challenge. Data are mean ± SEM of at least 5 independent experiments. Comparative statistical analysis was performed by Kruskal-Wallis 1-way ANOVA.

