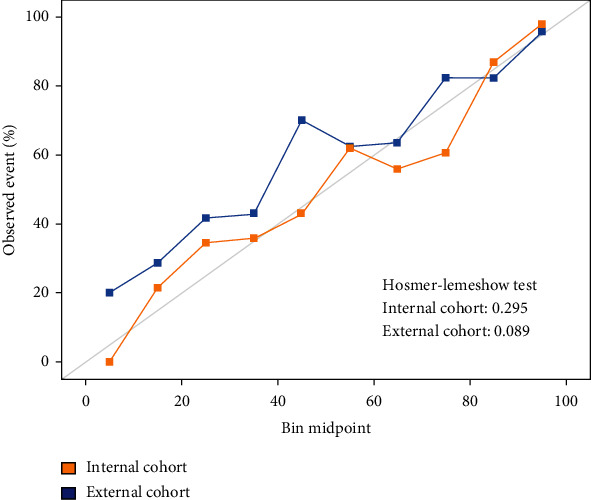
Figure 4.

Graphic representation of the Hosmer-Lemeshow test showing nonsignificant differences between observed and predicted values in both cohorts.

Graphic representation of the Hosmer-Lemeshow test showing nonsignificant differences between observed and predicted values in both cohorts.