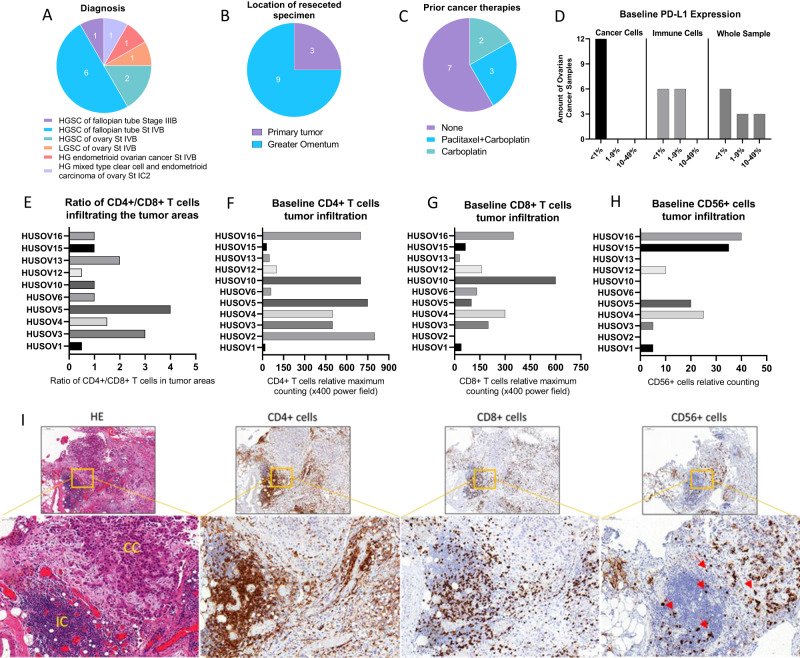
Fig. 1. Ovarian cancer evaluation of baseline immune-status by immunohistochemistry and samples diagnosis characteristics.
Upon arrival, fragments of ovarian cancer samples were fixed and embedded into paraffin blocks, and staining with HE and immunohistochemistry for CD4 + T, CD8 + T, CD56+ and PD-L1+ cells were performed. A–C Chart graphs detailing ovarian cancer characteristics on A diagnosis, B location of resected specimen, and C prior cancer therapies. D Expression of PD-L1 percentages levels on cancer cells, immune cells and overall counting in ovarian cancer samples. E Ratio of CD4+/CD8+ T cell infiltration across study samples. F Baseline maximum counting of CD4+ T cell infiltration across all ovarian cancer tumors in x400 power field. G Baseline maximum counting of CD8+ T cell infiltration across all ovarian cancer tumors in ×400 power field. H Baseline relative counting of CD56+ infiltrating lymphocyte present in each ovarian cancer samples. I Photos of slides representing lymphocytic infiltration in an ovarian cancer sample. From left to right, HE staining showing in yellow cancer cells (CC) and immune cells (IC) grouping, CD4+ T cells (brown), CD8+ T cells (brown), and CD56+ cells (red arrows) distribution in the same tumor area.IHC photos from HUSOV16 slides were used to exemplify the lymphocytic infiltration pattern. Upper row ×26 magnification (scale bar 200 µm) and lower row ×33 magnification (scale bar 100 µm). Partial data was published as Quixabeira et al. [27] at ESMO Immuno-Oncology 2022.

