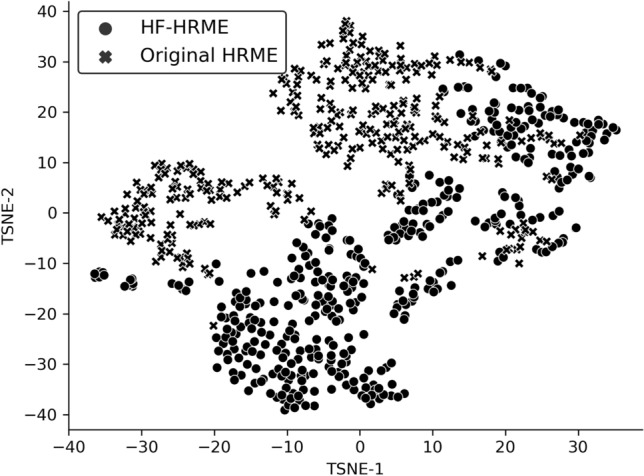
Figure 4.

t-SNE visualization of features generated by the MTN from images acquired with HF-HRME in the current study and with the original HRME in the pilot study. Each point corresponds to features from a single image quadrant and is labeled by study. Study-specific clusters indicate a significant feature shift. t-SNE t-distributed stochastic neighbor embedding, MTN multi-task network, HF-HRME high frame rate high-resolution microendoscope, HRME high-resolution microendoscope.
