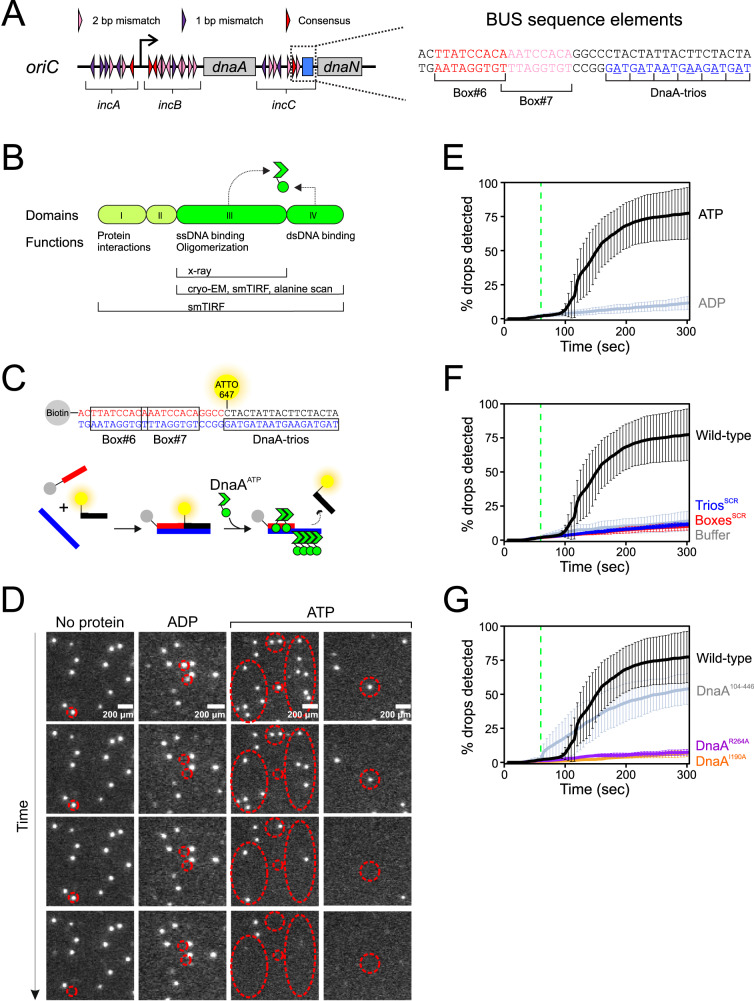
Fig. 1. DnaA strand separation events visualised by single molecule TIRF microscopy.
A Schematic representation of the B. subtilis replication origin and BUS sequence elements. DnaA-boxes are indicated with triangles. B Linear arrangement of DnaA domains I-IV. Locations of critical activities are shown. Endpoints of DnaA proteins used for various experiments are indicated. C Schematic describing single molecule TIRF microscopy experiments to investigate BUS activity. BUS sequence elements are indicated by colour. D Fields of view from single molecule TIRF experiments performed using different conditions (indicated on top) as a function of time. Red circles indicate spots that disappear over time. E Graph representing the percentage of fluorescent signals with decreased intensity over time in the presence of either ATP or ADP. F Graph reporting the percentage of fluorescent signals with decreased intensity over time using wild-type or mutant scaffolds. G Graph representing the percentage of fluorescent signals with decreased intensity over time using DnaA variants. DnaA104–446 lacks domains I-II. DnaAR264A is defective in oligomerisation. DnaAI190A is defective in ssDNA binding. For all graphs, data shows the average and percentage standard deviation from three independent experiments (source data are provided as a Source Data file).

