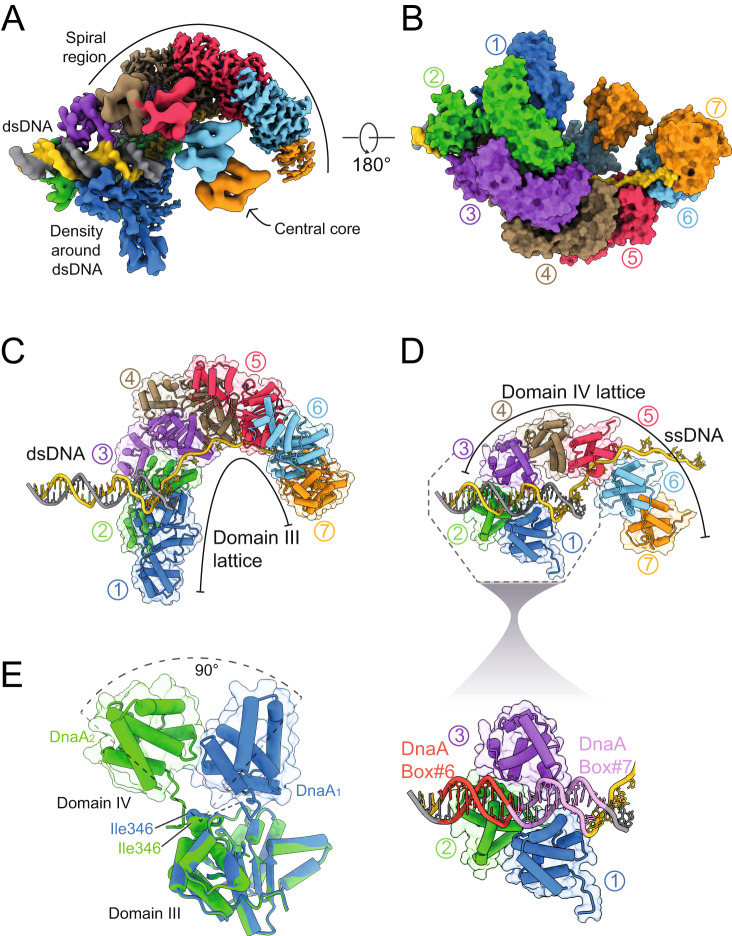
Fig. 2. Cryo-EM structure of the BUS complex and dsDNA engagement.
A Composite electron density map of the BUS, resulting from the assembly of maps corresponding to the spiral, central core, and the dsDNA regions contoured at 0.6σ, 0.21σ and 0.27σ respectively. The map is coloured based on seven DnaA protomers (blue, green, purple, brown, pink, cyan and orange respectively), the DnaA-trio containing DNA strand (yellow), and the complementary strand (grey). B Surface representation of the BUS complex coloured based on the respective DnaA protomers and DNA strands. C Model of the domain III lattice that makes up the spiral region of the map. Both the DNA scaffold and protein are shown in cylinder and stubs representation, with the protein also shown in a transparent surface representation. D Model of the domain IV lattice that makes up the central core of the map. Both the DNA scaffold and protein are shown in cylinder and stubs representation with the protein also shown in a transparent surface representation. The enlarged section shows domain IV of DnaA1 and DnaA2 engage with DnaA-box#7 and DnaA-box#6, respectively, while domain IV of DnaA3 engages the posterior minor groove. E Structural alignment of the DnaA1 and DnaA2 showing the domain IV of DnaA1 and DnaA2 are 90° apart relative to domain III.

