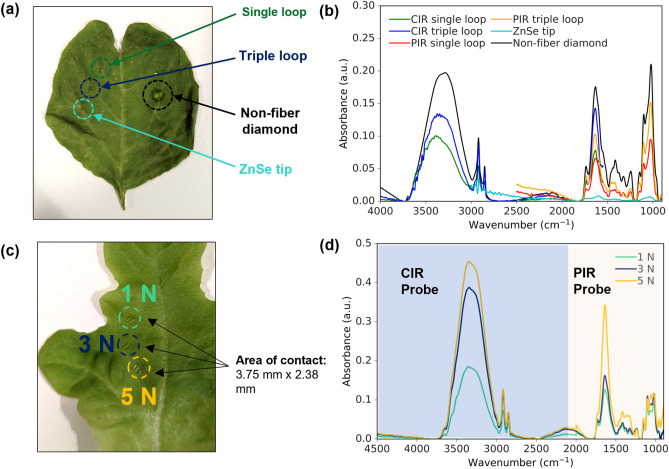
Figure 2.
(a) Stress marks on a green spinach leaf after the measurements using the different probes. (b) Infrared absorption spectra in the range of 4000–900 cm−1 using a CIR single loop (green curve), a CIR triple loop (blue curve), a PIR single loop (red curve), a PIR triple loop (orange curve), a ZnSe tip (cyan curve), and a non-fiber diamond ATR (black curve). (c) Stress marks on a green lettuce leaf after measurements using 1 N, 3 N and 5 N force respectively. (d) Combined infrared spectra of CIR and PIR triple loop measurements of the leaf with a contact force of 1 N (green curve), 3 N (blue curve) and 5 N (orange curve). The CIR region is marked with blue background and the PIR region is marked with light yellow background.

