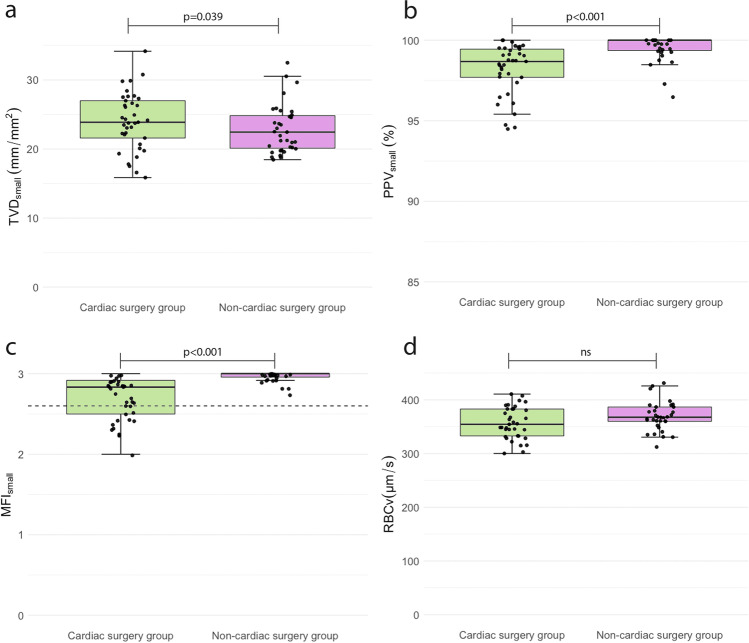
Fig. 2.
Microcirculatory parameters at (T1) before surgery: cardiac surgery group versus non-cardiac surgery group. The box plots are median data (interquartile range) of microcirculatory parameters for small vessels (< 20 μm) at (T1) before surgery. The dotted line in graph c represents the cutt-off value of 2.6 for a disturbed MFI. The p-value for TVDsmall was derived from the linear regression model, corrected for age and sex. The p-values for PPVsmall, MFIsmall, and RBCv were derived from the Mann-Whitney U tests. A p-value < 0.05 was considered significant. NS = p-value was not significant. TVD total vessel density, PPV proportion of perfused vessels, MFI microcirculatory flow index, RBCv red blood cell velocity

