
Figure 1:
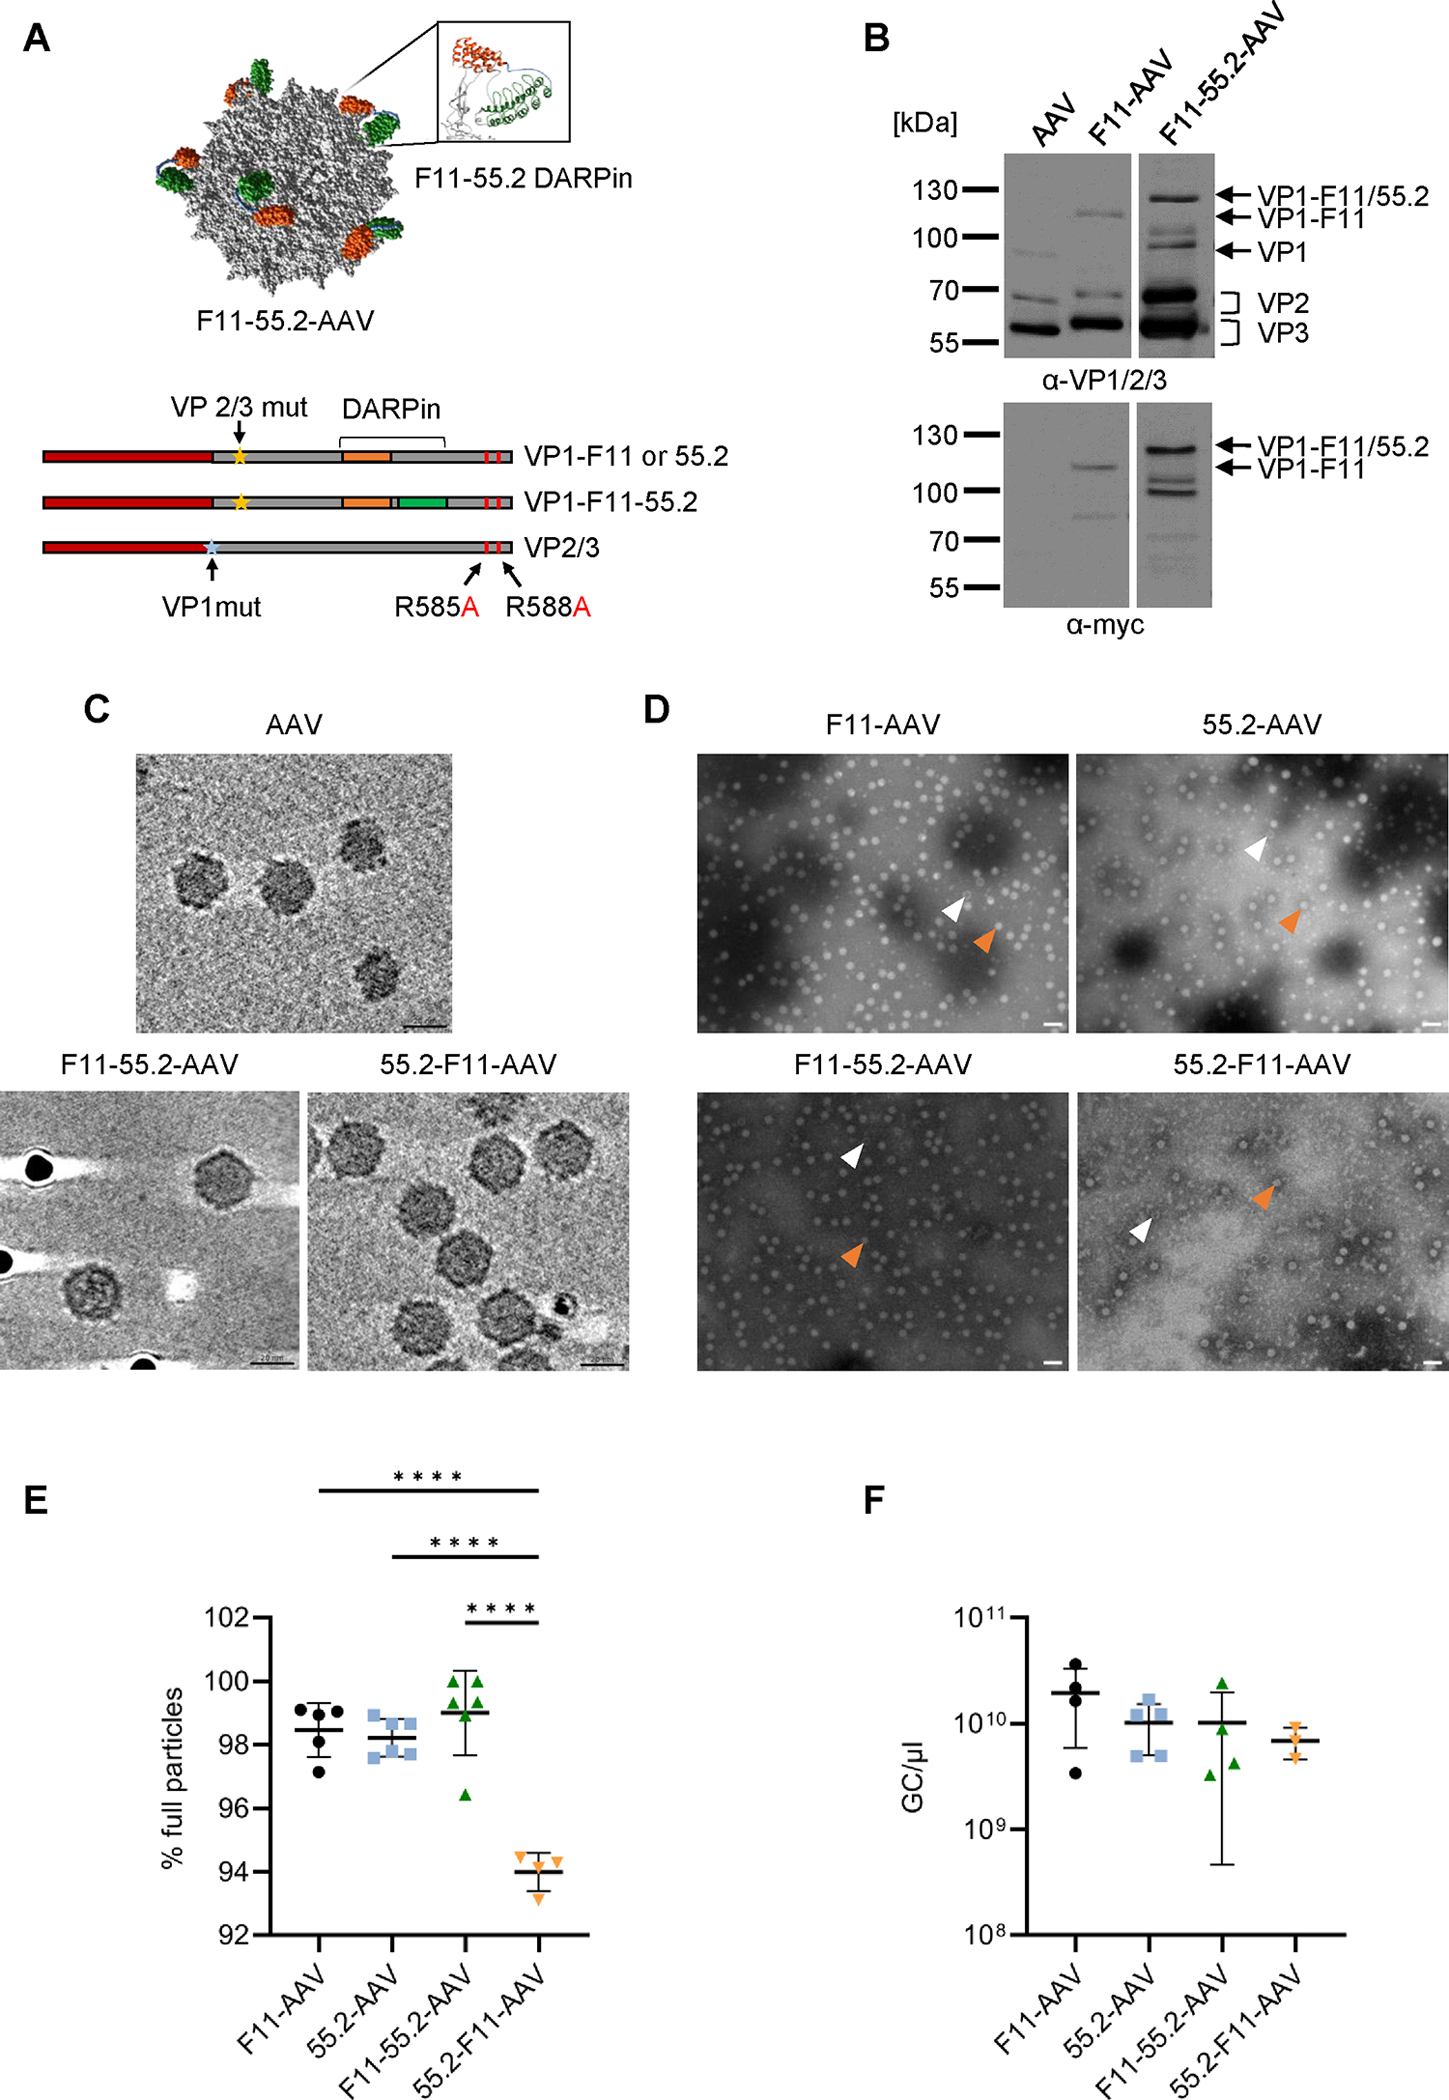
Biophysical characterization of bispecific AAV vectors.
A) Upper part: AlphaFold capsid structure prediction of bispecific CD32a-CD4-AAV based on the structure of AAV2 particles (PDB:1LP3). 55.2-F11 conjugated to VP3 was de novo folded and overlayed onto the particle crystal structure. DARPin F11 is shown in green, 55.2 in orange. The inlet shows the GH2/3 loop with the bispecific DARPin inserted. Lower part: Schematic drawings of reading frames in the plasmids encoding the capsid proteins. Yellow asterisks indicate disrupted splice acceptor sites preventing expression of VP2/3. The blue asterisk indicates the mutated start codon of VP1. DARPin reading frames are highlighted by orange and blue bars. The point mutations R585A and R588A ablating HSPG binding are labeled by arrows. B) Detection of capsid proteins in the indicated AAV stocks by Western blotting using the anti-VP1/VP2/VP3 B1 antibody (upper panel) and a myc-specific antibody (bottom panel). Contrast of images were adjusted retaining relative signal strength. C-E) Morphology and full/empty particle ratio of AAV stocks. C) Cryo-ET analysis of AAV2, F11-55.2-AAV and 55.2-F11-AAV. The dark spots are protein-A-colloidal gold particles added to the sample just before plunge-freezing. Scale bar indicates 20 nm. D) TEM analysis of vector stocks stained with phosphotungstic acid. Orange arrows point to full particles, white arrows to empty particles. Images were taken with a 50,000-fold magnification and the scale bar represents 50 nm. E) Numbers of full and empty particles of each vector type were determined by TEM. At least four images per vector stock were analyzed and plotted as percentage of full particles. F) Vector genome titers determined by ITR-specific qPCR. Each symbol represents one vector stock (F11-AAV n=4, 55.2-AAV n=5, F11-55.2-AAV n=4, 55.2-F11-AAV n=3). Statistical differences in E and F were calculated by one-way analysis of variance (ANOVA) followed by Tukey’s multiple comparisons test. Standard deviation is reported. P-value **** < 0.0001. Only significant differences are shown. The statistical comparison of all groups in each data set is available in the supplements.