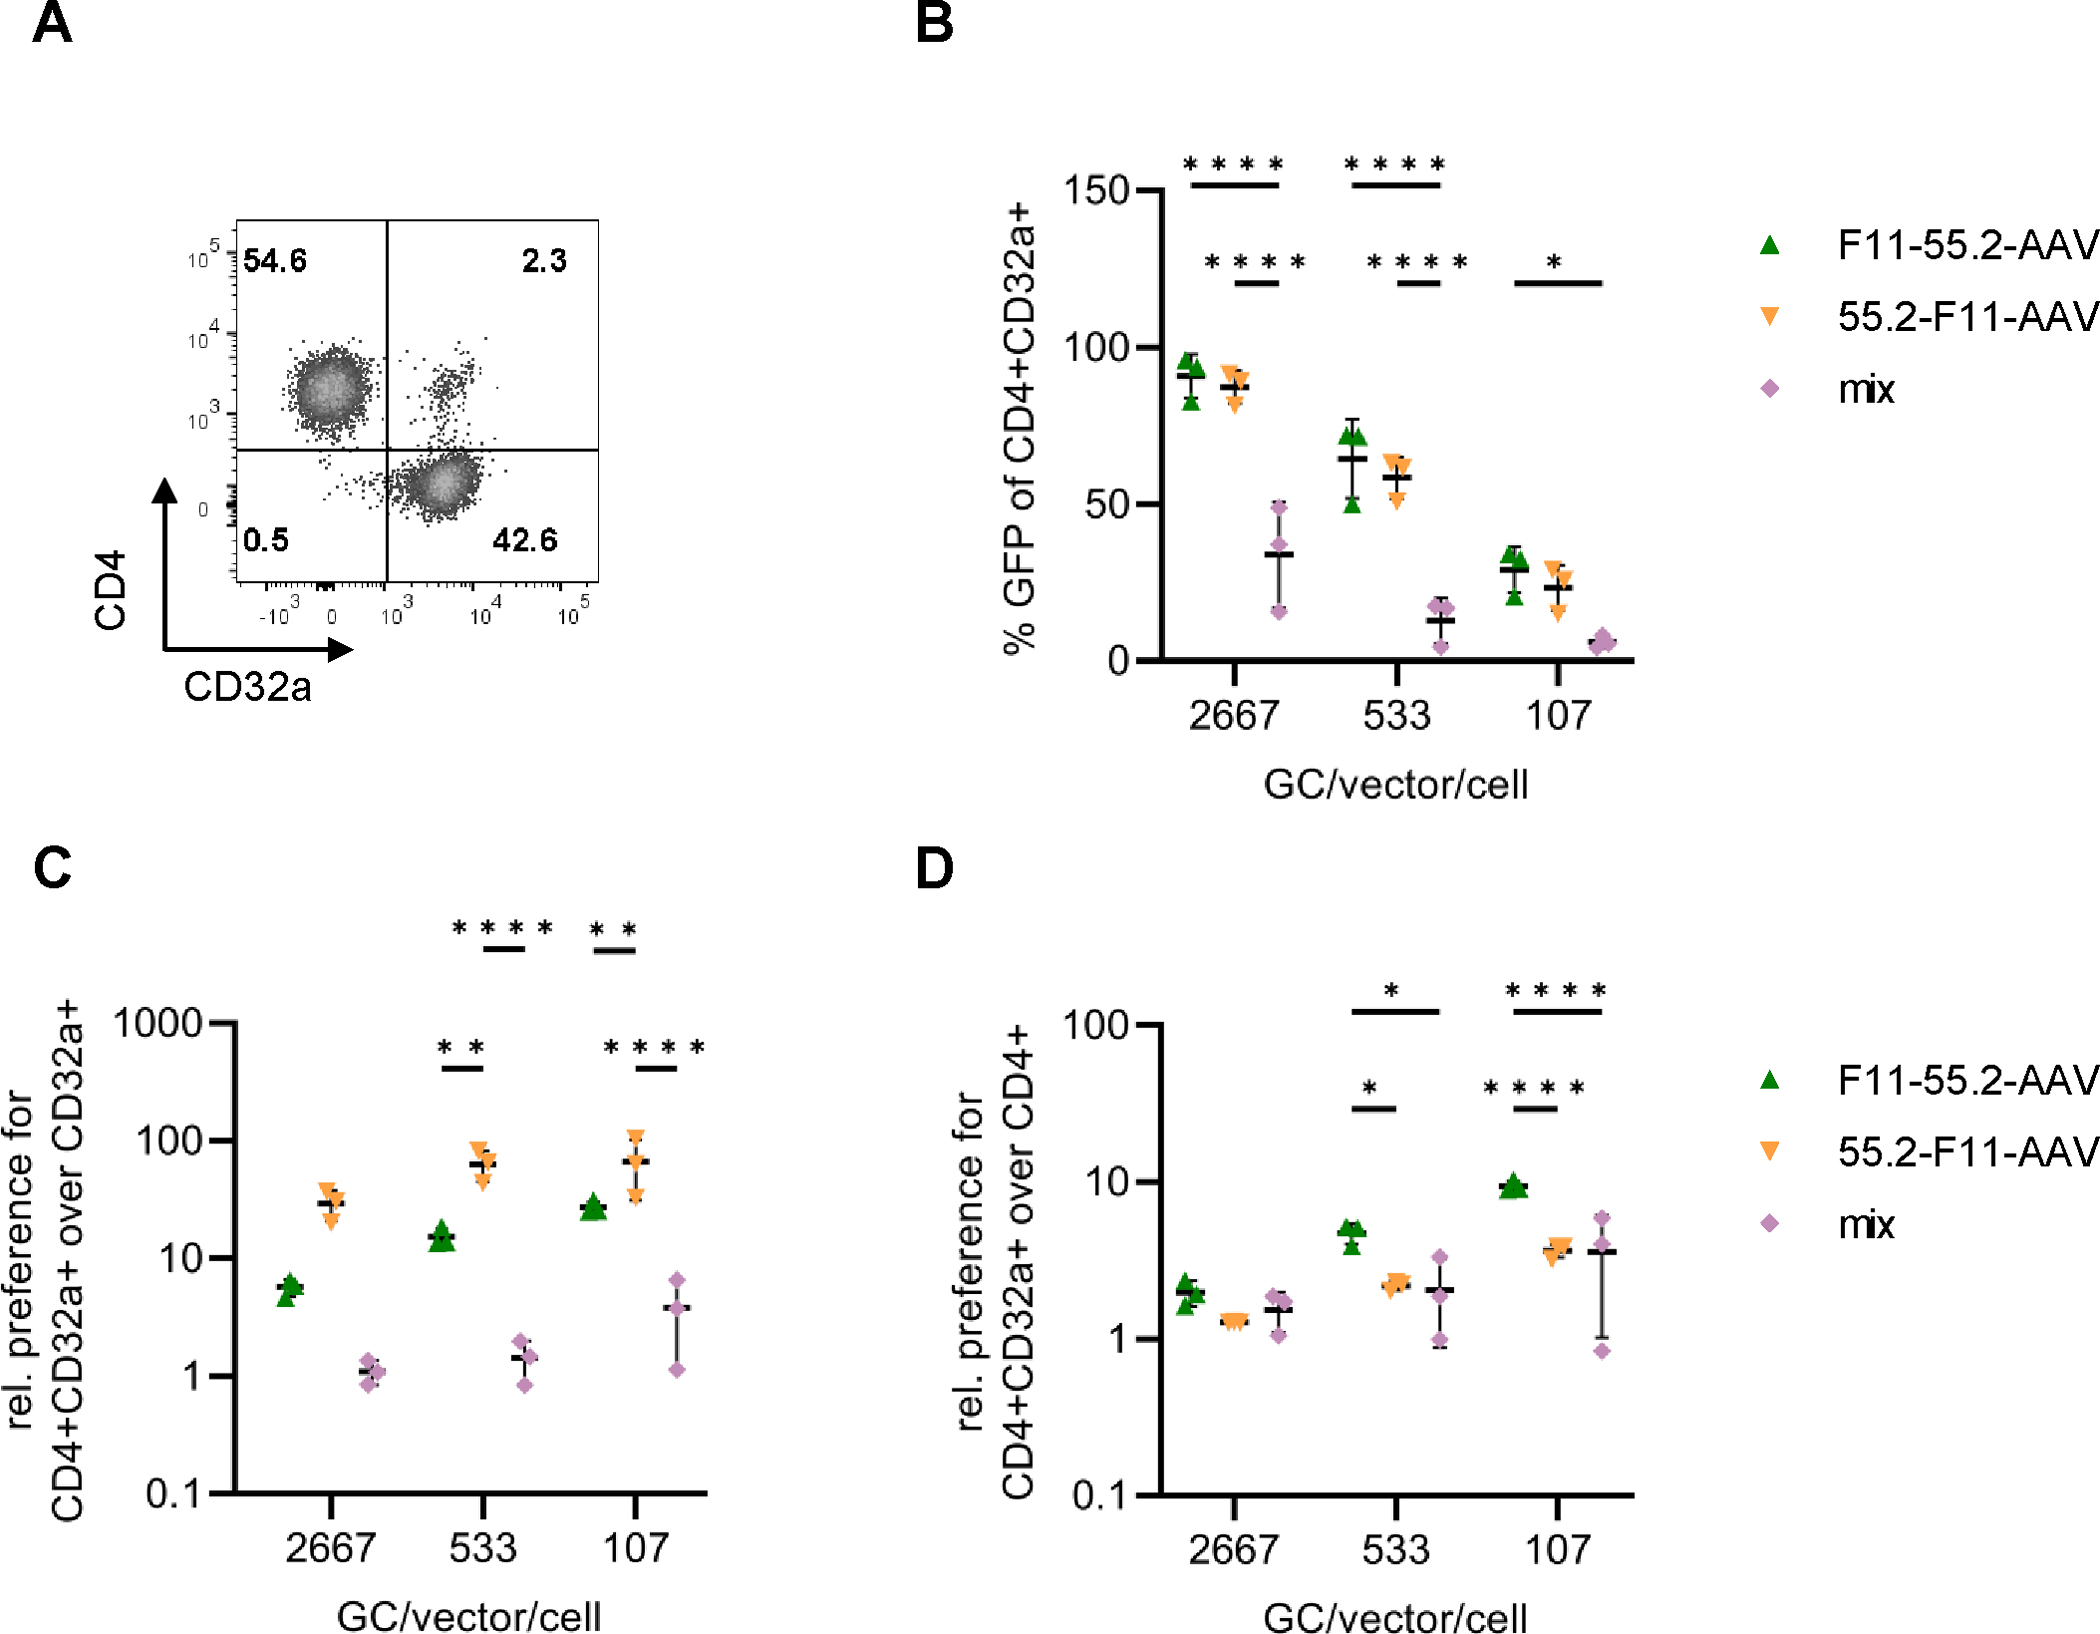
Figure 3:

Transduction of underrepresented CD4+CD32a+ at low GC/cell.
A) Composition of the cell mixture used to assess transduction efficiencies. The percentages of SupT1-CD4, SupT1-CD32a and SupT1-CD4/CD32a cells are indicated in the respective quadrants. B-D) The cell mixture was exposed to 55.2-F11-AAV, F11-55.2-AAV or a 1:1 mixture of F11-AAV and 55.2-AAV (mix) at the indicated GC/cell, respectively. For the mixture, the dose for each vector type is provided. Percentages of GFP+ cells among CD4+/CD32a+ cells were determined and ratios over CD32a+/GFP+ cells (C) or over CD4+/GFP+ cells calculated (D). Statistical differences of three independent experiments were calculated using two-way ANOVA followed by Tukey’s multiple comparisons test. The standard deviation is reported. P-value **** < 0.0001, p-value ** = 0.001–0.01, p-value * = 0.01–0.05. Only significant and relevant statistical comparisons are shown. The statistical comparison of all groups in each data set is available in the supplements.
