Figure 5:

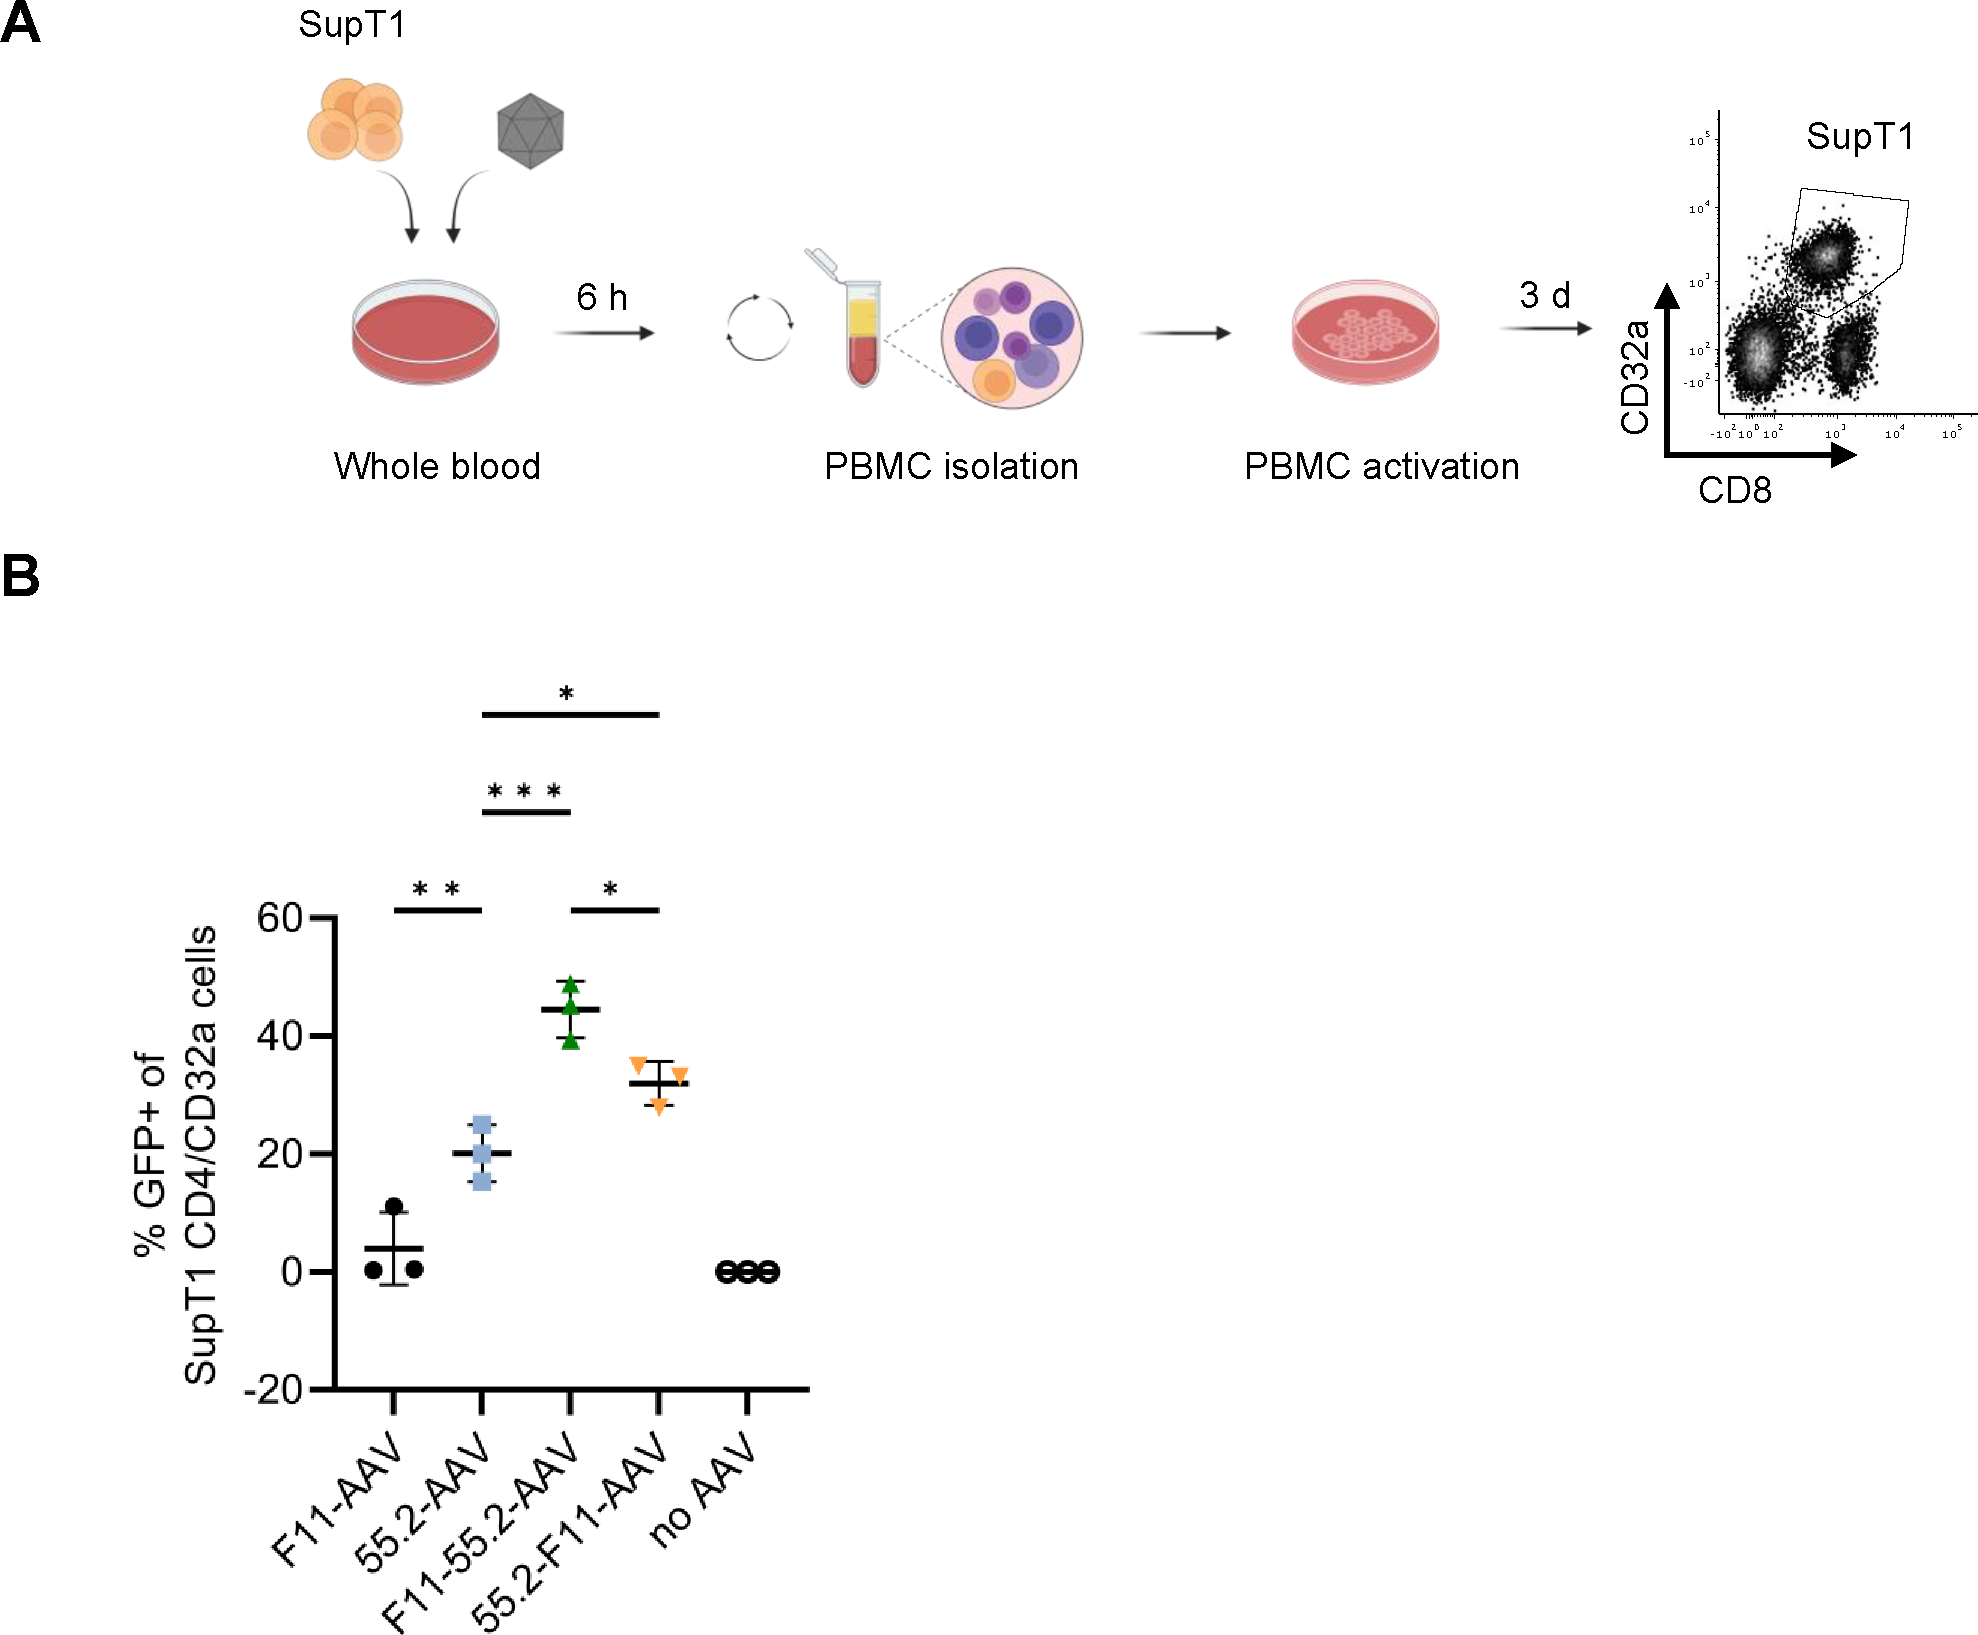
Transduction of CD4+/CD32a+ cells in human blood.
Four hundred μl whole blood spiked with 1×10⁵ SupT1-CD4/CD32a cells was mixed with 8×10⁸ GC of the indicated AAVs for 6 h at 37°C while shaking. Subsequently, SupT1 cells were isolated by density centrifugation, activated with anti-CD3 and anti-CD28 antibodies and cultured for three days in Nutri-T media supplemented with IL7 + IL15. At the time of analysis, SupT1 cells (CD8dim/CD32a+) were identified by staining with anti-CD32a and anti-CD8 using flow cytometry. The workflow is shown in (A). The percentages of GFP-positive SupT1-CD4/CD32a cells are shown in (B). The gating strategy is represented in Fig. S6. Three blood donors were used for this experiments and statistical differences were calculated using one-way ANOVA followed by Tukey’s multiple comparisons test. The standard deviation is reported. ***p = 0.0001–0.001, **p = 0.001–0.01, *p = 0.01–0.05. Only significant and relevant statistical comparisons are shown. The statistical comparison of all groups in each data set is available in the supplements.
