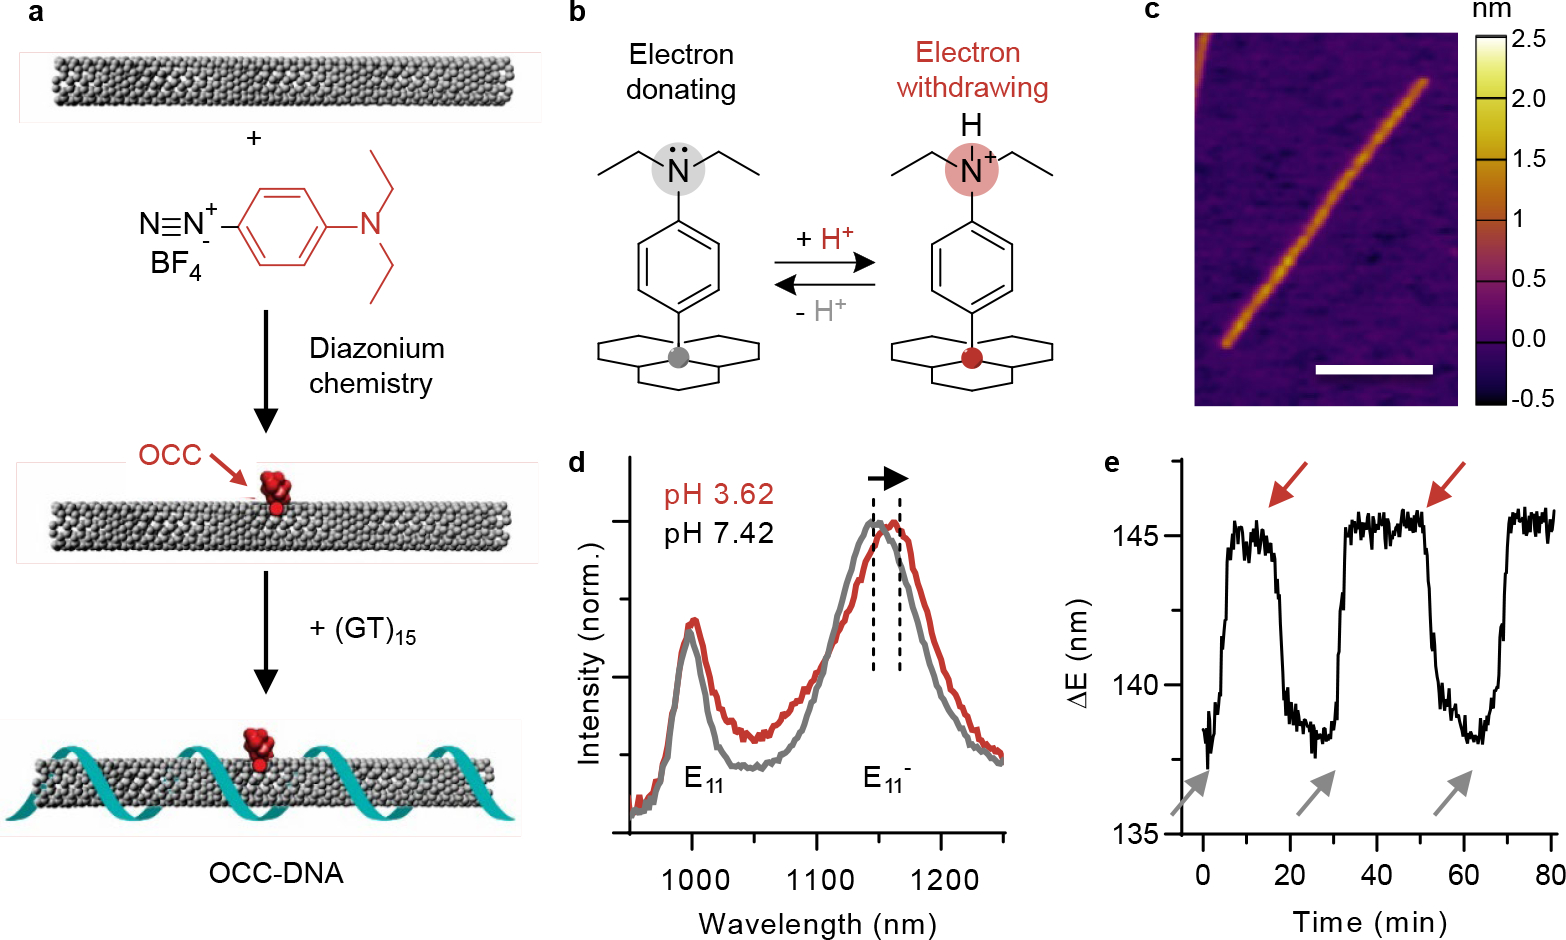
Fig. 1 |. Synthesis of pH-responsive OCC-DNA complexes.

a, Schematic of the synthesis of OCC-DNA complexes. b, Schematic of the molecular mechanism of response that involves mechanism - protonation and deprotonation of the N,N-diethylamino moieties group on the aryl OCC. c, AFM image of OCC-DNA complex. Scale bar = 100 nm. Color map denotes height. d, Representative near-infrared fluorescence spectra of OCC-DNA complexes in PBS at pH 3.14 (red) and pH 7.02 (gray) at 575 nm excitation. The arrow indicates the redshift of centre wavelength in acidic buffer solution. e, Dynamics of OCC-DNA response and reversal in buffer at pH = 7.09 (gray arrows) and 3.32 (red arrows) at 575 nm excitation. The spectral shift is as measured from the emission peak centre wavelengths.
