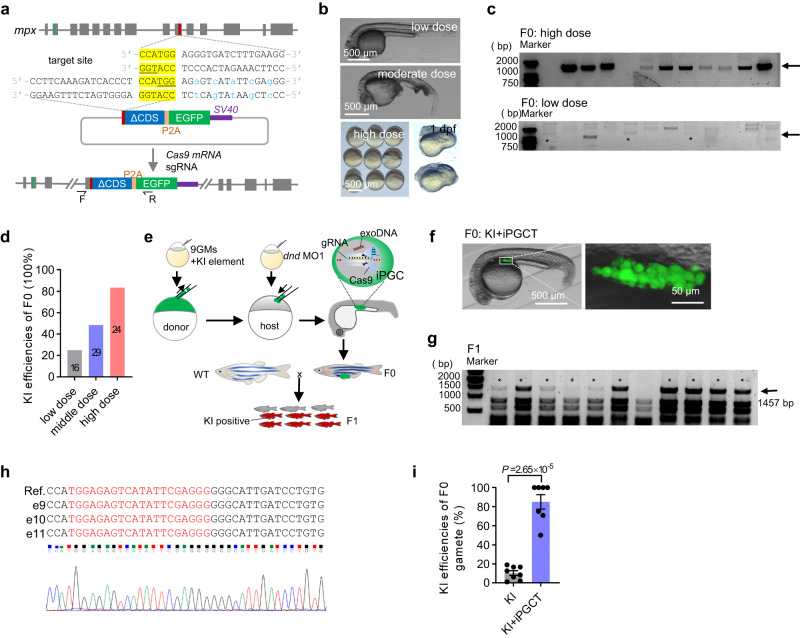
Fig. 5. iPGCT greatly improved the knock-in (KI) efficiency of gametes.
a Schematic diagram of KI strategy mediated by microhomology-mediated end-joining (MMEJ). GFP was inserted into exon 10 of mpx and the missing CDS sequence was added in the KI vector. The underlined bases are PAM regions, the yellow bases are microhomology sequences, and the blue bases are bases with synonymous mutations. b With the increase of KI reagent doses, the embryos displayed increasingly serious abnormalities. Low dose (50 pg gRNA, 50 pg plasmid, and 500 pg cas9 mRNA); moderate dose (100 pg gRNA, 100 pg plasmid, and 1000 pg cas9 mRNA); and high dose (200 pg gRNA, 200 pg plasmid, and 1000 pg cas9 mRNA). c Single embryos were used to evaluate the efficiency of KI events. The arrow indicates the positive bands (1457 bp), and the asterisk represents the positive embryos at low dose. d KI efficiency of F0 embryos at different doses. The number on the column represents the total number of embryos tested. e Schematic diagram showing KI combined with iPGCT to efficiently produce KI progeny. f The iPGCT embryos harboring KI iPGCs were obtained according to the process illustrated in e. g F0 was mated with the wild-type, and 12 embryos were selected for identification one by one to evaluate the KI efficiency of F0 gamete. The arrow indicates the positive bands (1457 bp), and the asterisk represents the positive embryo. h Sequencing results of positive bands. gRNA target locations are marked in red. i KI efficiencies of F0 gametes producing positive F1. Each dot represents the rate of KI gametes from one F0 fish (n ≥ 7). A representative example of three replicate is shown. All data are presented as mean values ± SEM. Two-tailed Student’s t-test was used to calculate the P values.

