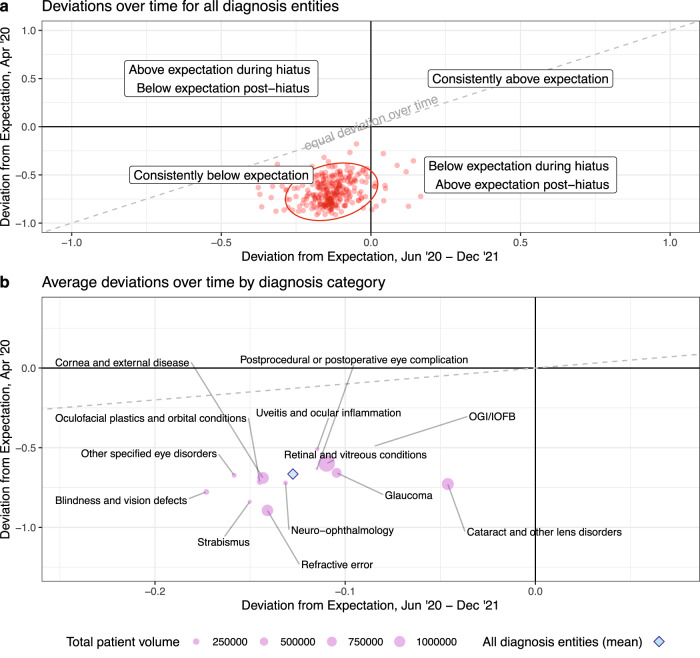
Fig. 3. Hiatus vs. post-hiatus deviations across all diagnosis entities.
Deviations during the nadir of the hiatus period (April 2020) are plotted against deviations in the post-hiatus period (June 2020– December 2021), for all 261 diagnosis entities individually (red points in (a)) and averaged across the diagnosis entities that belong to each diagnosis category (pink circles in (b)). In (a), the 95% normal data ellipse (red oval) represents an estimated probability contour that is expected to contain 95% of all plotted diagnosis entities, and a line of equality (dashed gray line) represents no change in deviations over time (i.e., deviations during April 2020 are equal to post-hiatus deviations). In (b), the size of each point corresponds to the cumulative number of average monthly patients for the diagnosis entities within a category. The blue diamond represents the average of all deviations for April 2020 (−0.67, standard deviation (SD): 0.14) and the post-hiatus period (−0.13, SD: 0.09) across all 261 diagnosis entities. Abbreviations: OGI/IOFB ocular globe injury/intraocular foreign bodies, Postop complications postprocedural or postoperative eye complication, Oculoplastics and orbital conditions oculofacial plastics and orbital conditions, SD standard deviation.

