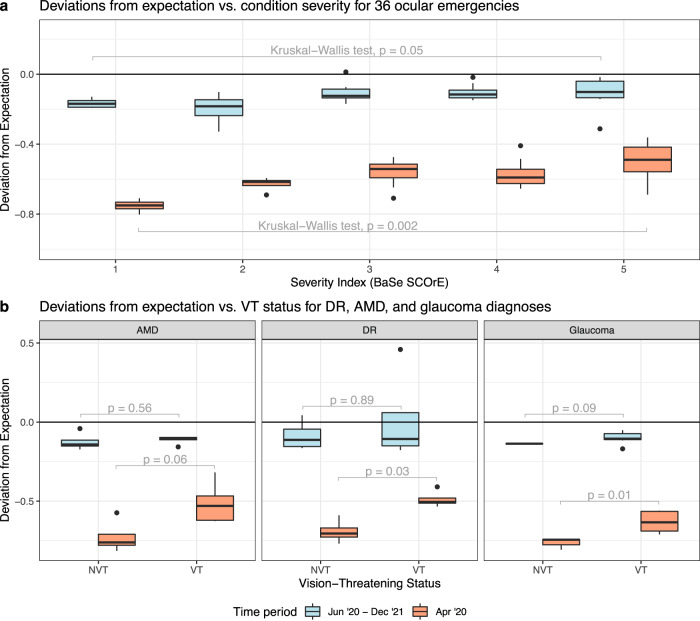
Fig. 5. Deviations by severity level for ophthalmic emergencies and common conditions.
Boxplots depicting distributions of deviations from expectation, during the hiatus (orange boxplots) and post-hiatus (blue boxplots) periods, stratified by (a) increasing levels of severity (derived from the aggregate BaSe SCOrE’s compiled by Bourges et al.) for a set of n = 36 diagnosis entities considered as common ocular emergencies, and (b) vision-threatening (VT) vs. non-vision-threatening (NVT) status for age-related macular degeneration (AMD), diabetic retinopathy (DR), and glaucoma diagnoses (Table S4) (n = 28 diagnosis entities in total). Outliers, indicated as black dots, are data points that are located at a distance greater than 1.5 times the interquartile range from either the lower quartile or the upper quartile of the boxplot. The ‘whiskers’ of the boxplots, which extend from the boxes as black vertical lines, represent the range of values that lie within 1.5 times the interquartile range from the lower and upper quartiles. To test for statistically significant differences in the central tendencies between distributions of deviations, we used Kruskal-Wallis (a) and Mann-Whitney U (b) tests to compute p-values (gray text). Abbreviations: BaSe SCOrE BAsic SEverity Score for Common OculaR Emergencies, DR diabetic retinopathy, AMD age-related macular degeneration, VT vision-threatening, NVT non-vision-threatening.

